
fig2
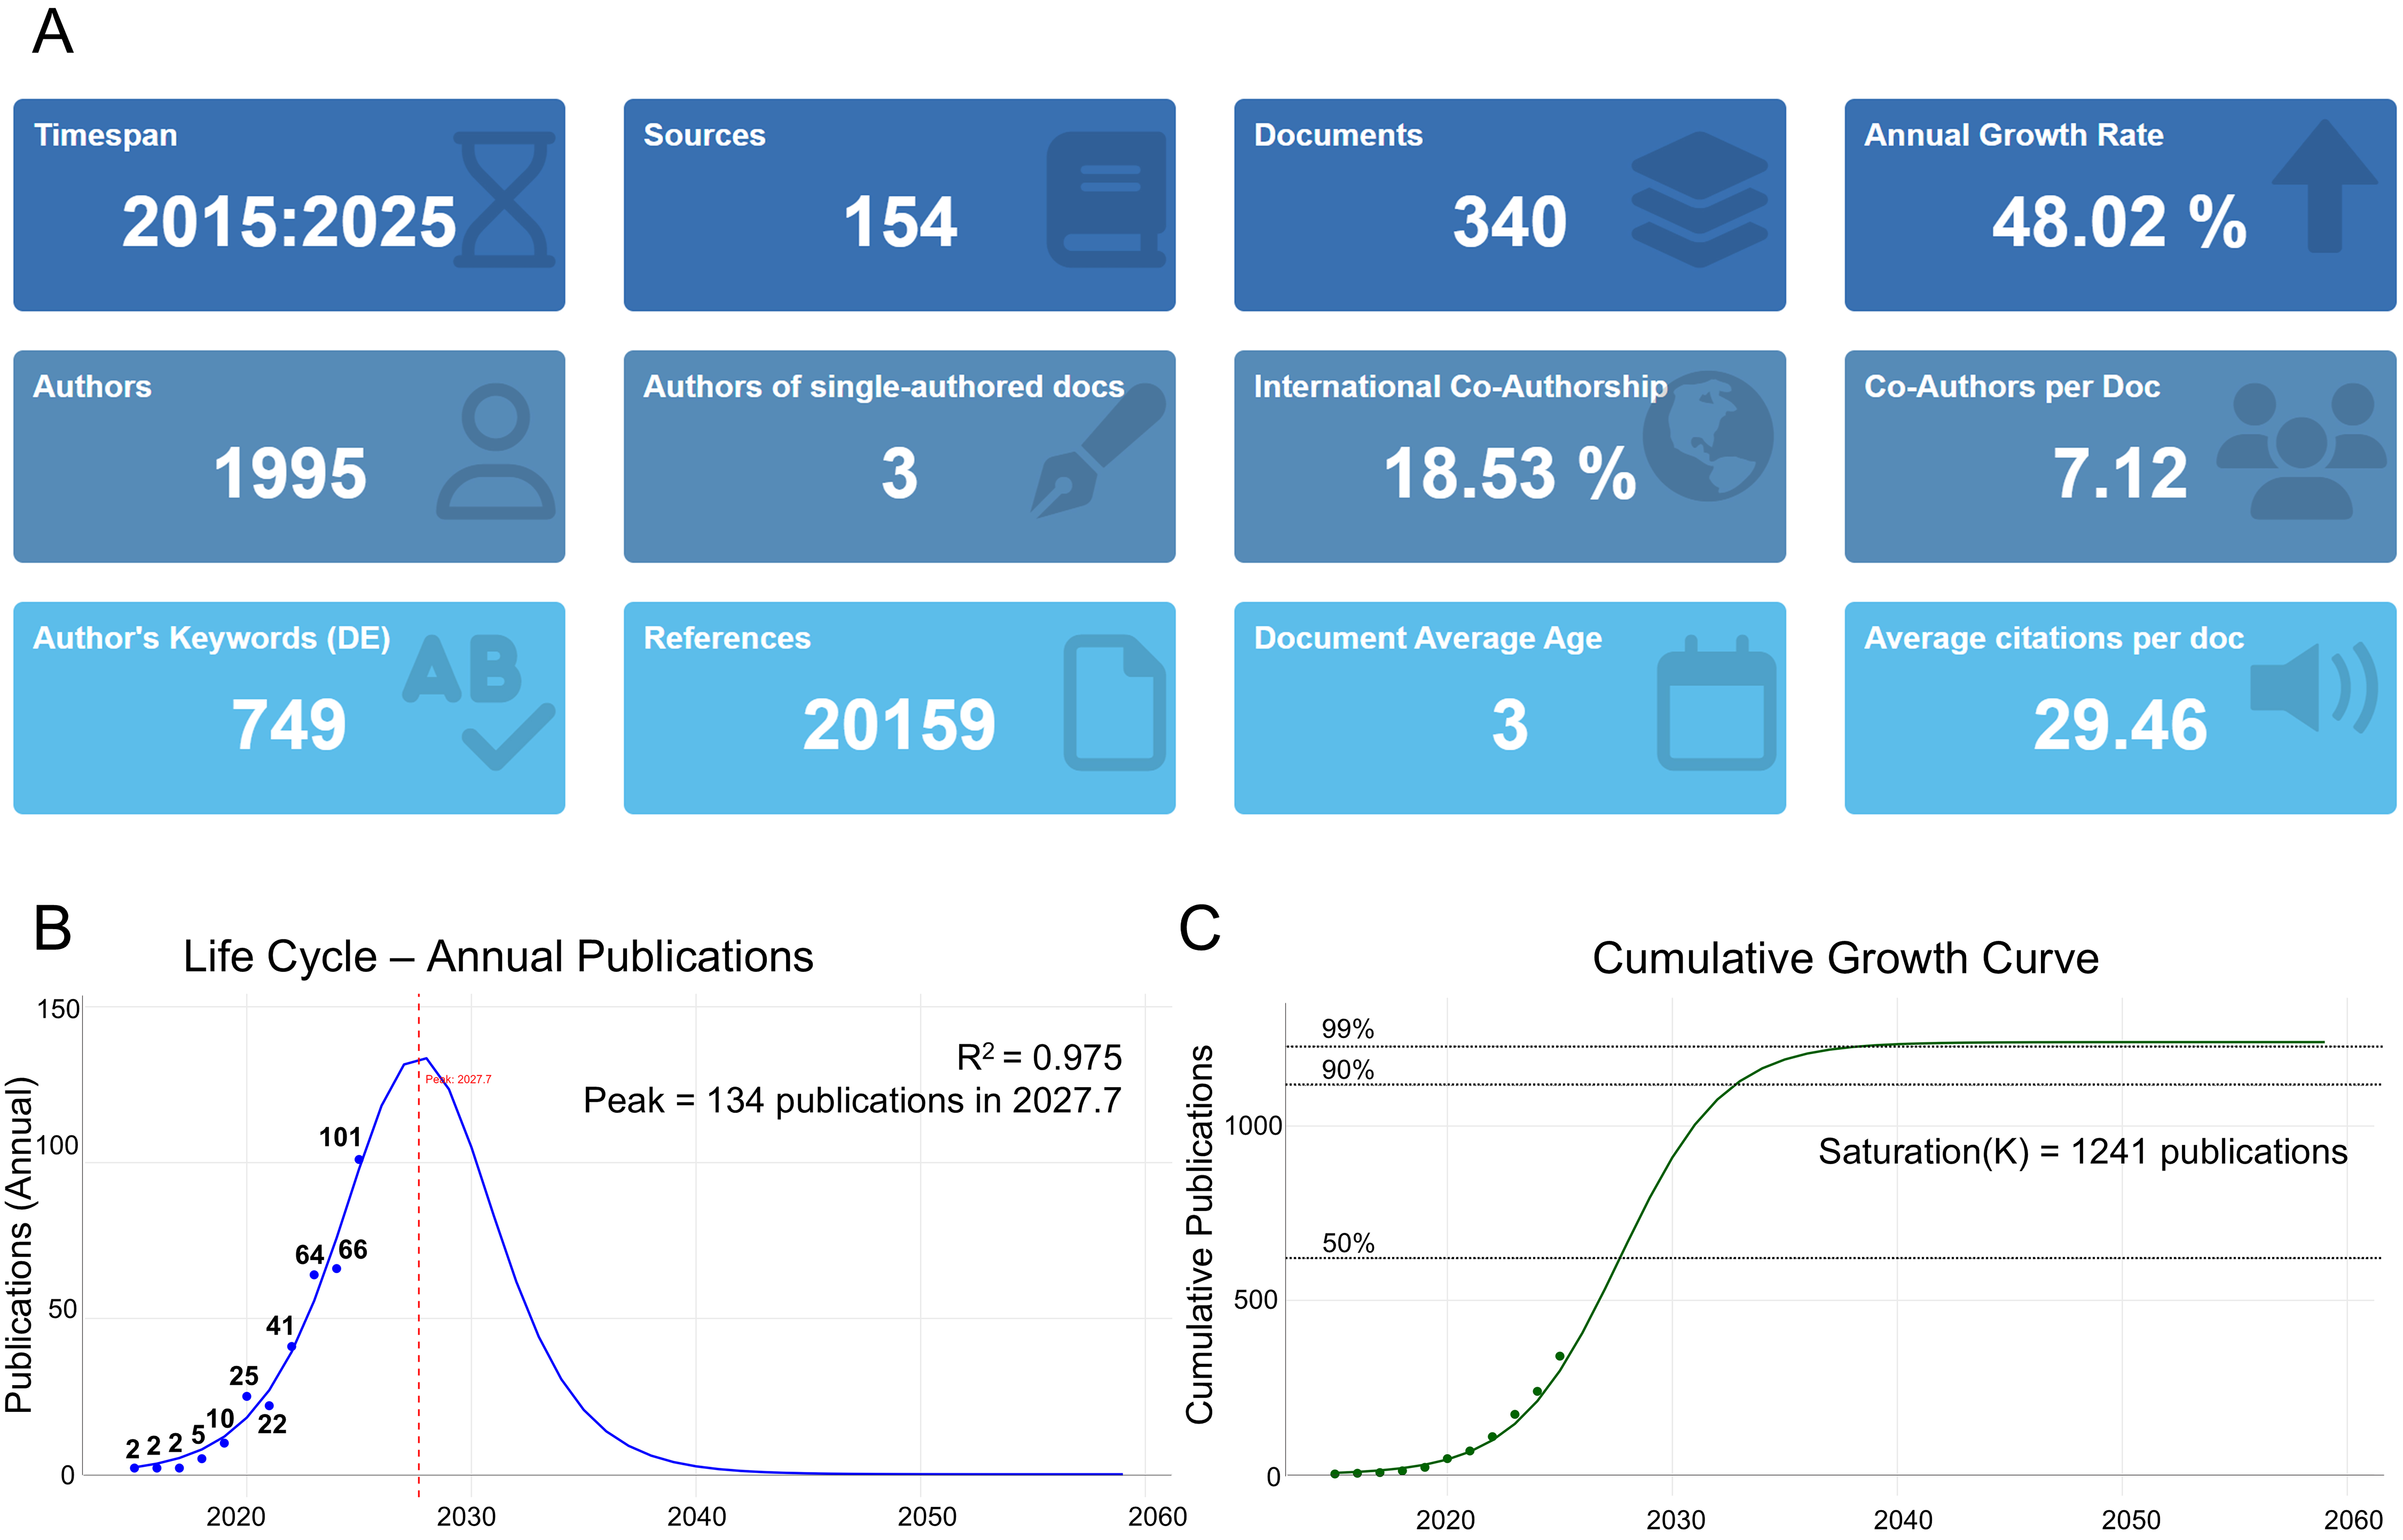
Figure 2. Analysis of all publications. (A) Main information about the collection; (B) and (C) life cycle of scientific production using a logistic growth model. (B) Annual publications curve: blue dots, observed annual publications from the collection; red dashed vertical line, peak year (Tm); (C) cumulative growth curve: green dots, observed cumulative publications; horizontal dashed lines, saturation thresholds. All analyses were performed using Bibliometrix v5.2.0. K: Maximum saturation capacity; R2: coefficient of determination; Tm: peak year.