

fig7
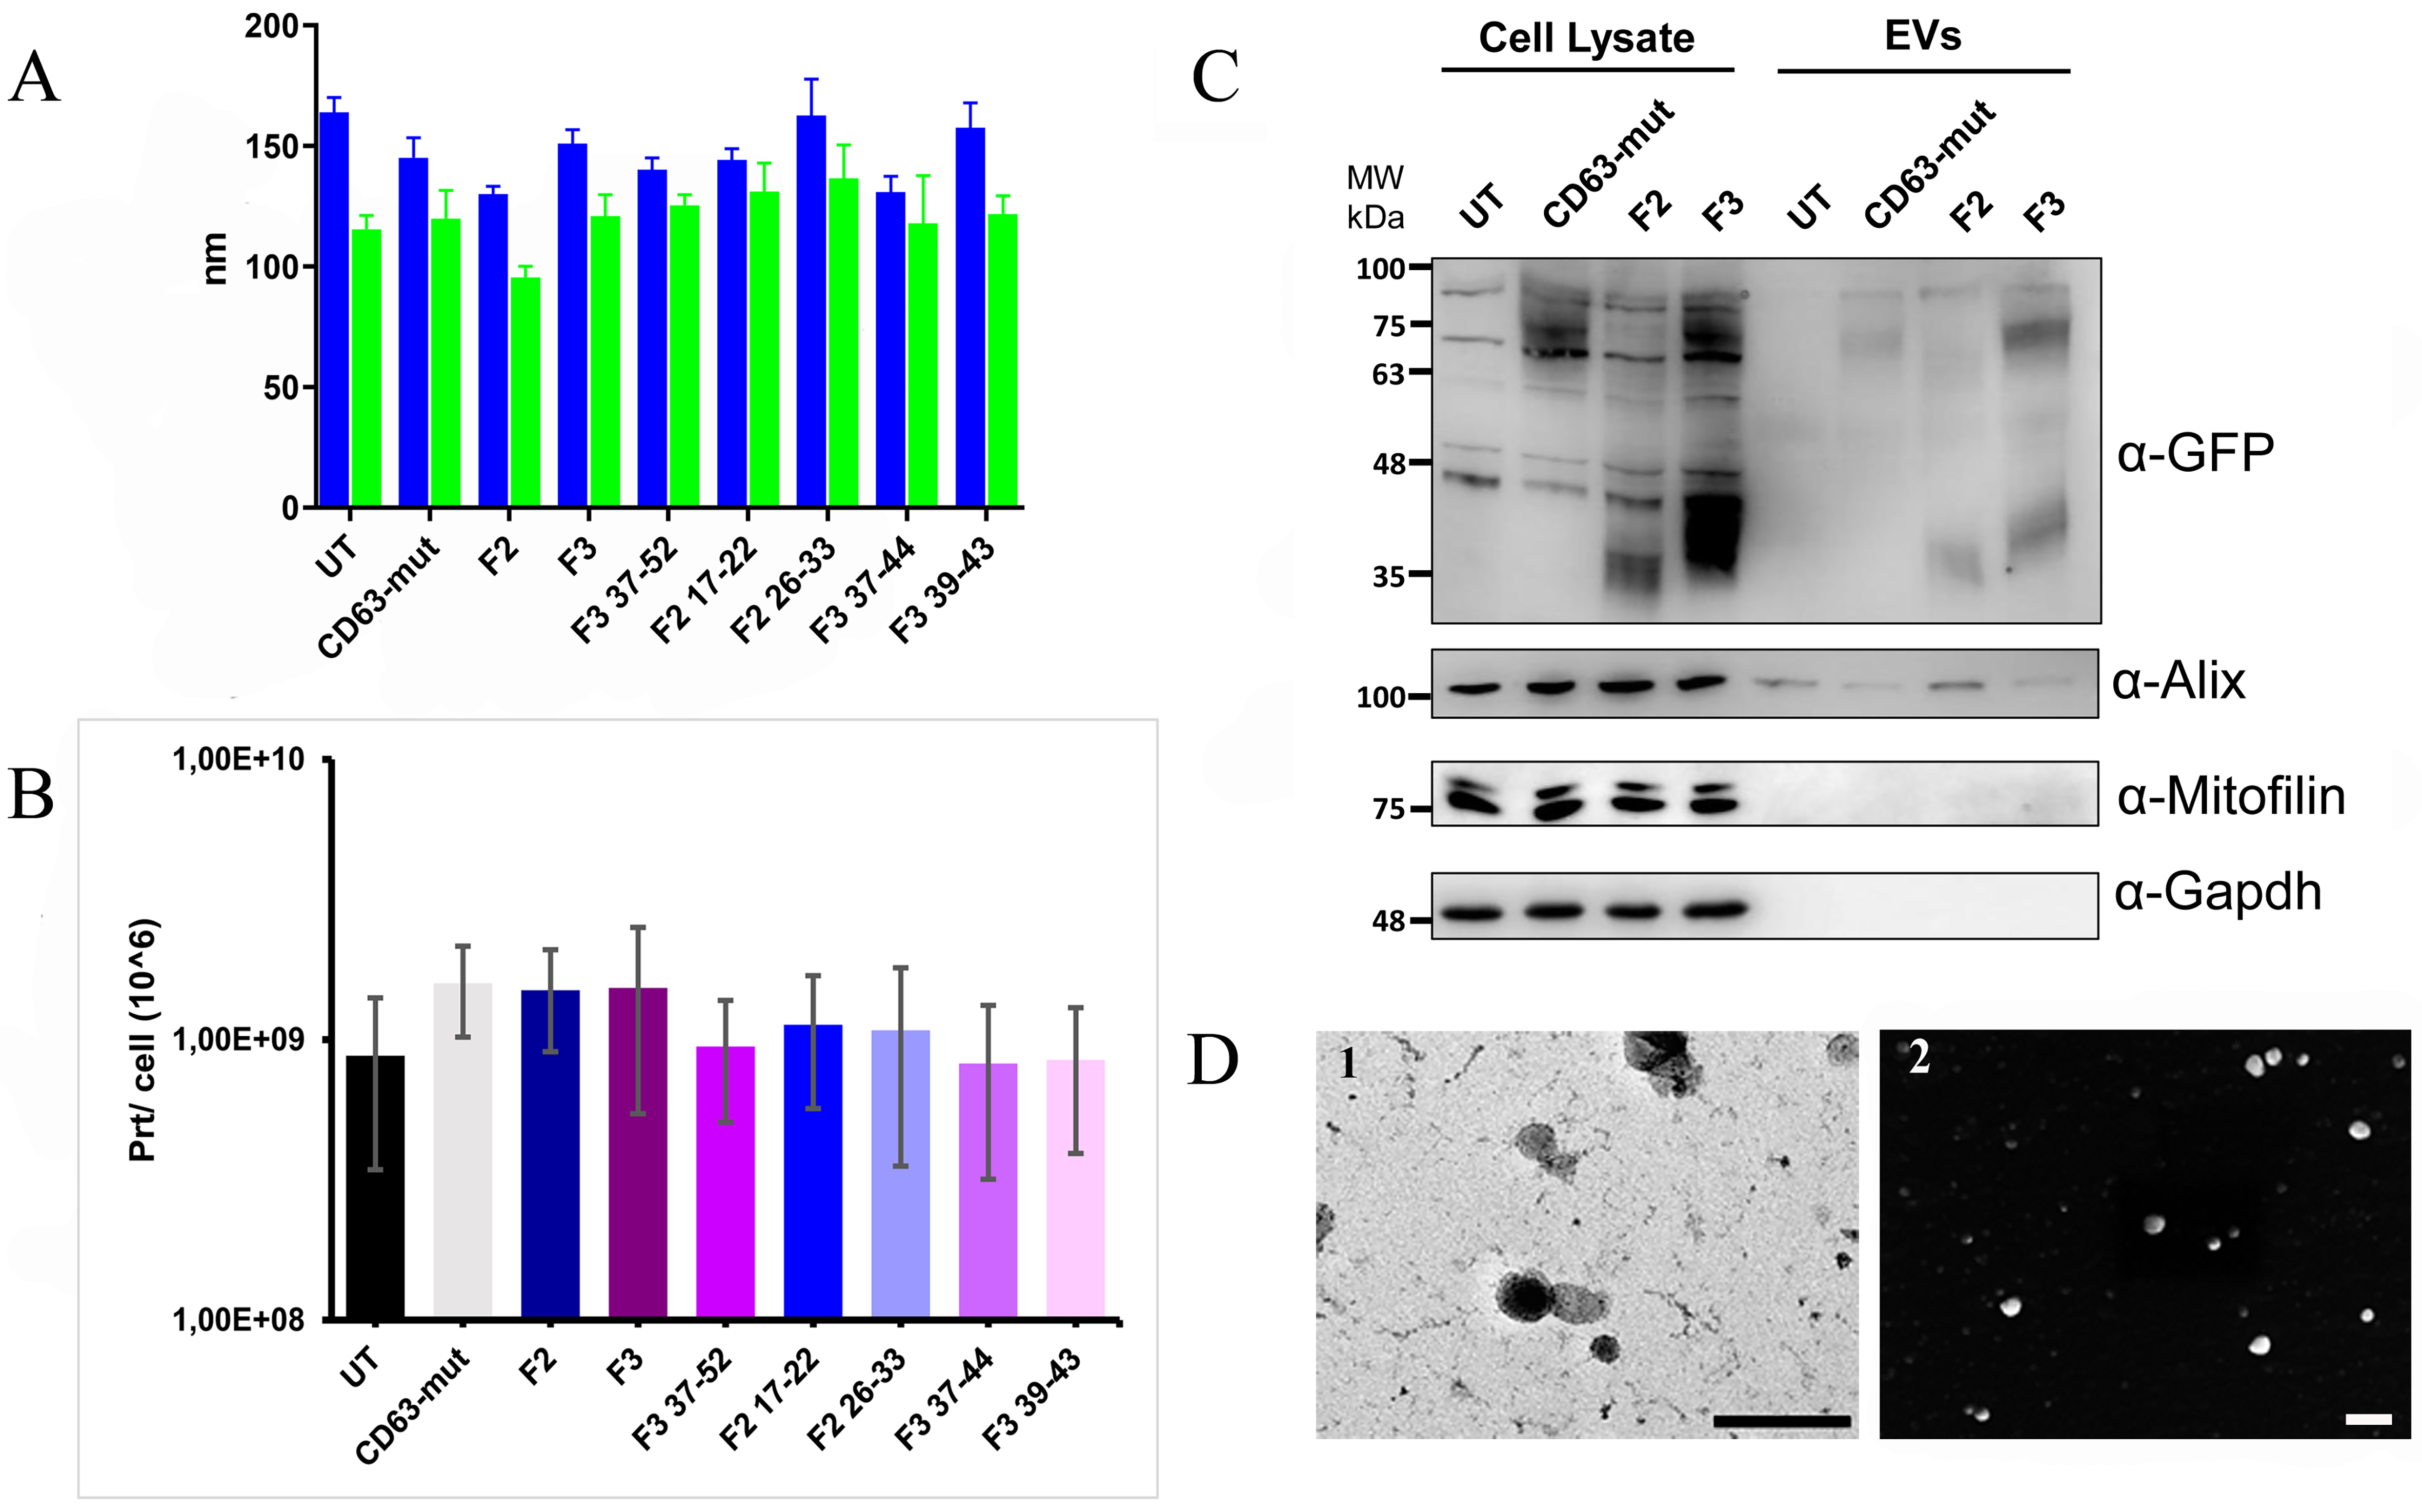
Figure 7. Characterization of MSC-EVs. (A) Size distribution of EVs derived from UT MSCs and MSCs transfected with the different plasmids, presented as a bar histogram; blue bars show the mean size, and green bars show the mode size; (B) EV recovery yield from conditioned medium of UT MSCs and MSCs transfected with different plasmids, normalized to the number of cells counted after conditioned medium collection and expressed as particles per million cells; (C) Western blot analysis of cell lysates and corresponding EVs from UT cells and cells expressing CD63-mut, F2-, or F3-engineered constructs, probed for GFP (construct expression/EV loading), Alix (EV marker), Mitofilin (mitochondrial contamination marker), and GAPDH (cytosolic contamination marker). The EV populations shown are representative of the engineered constructs and are not intended to depict the full panel of peptide variants characterized in this study; they confirm EV identity and purity across the engineering strategy rather than validate each individual peptide construct. Molecular weight markers are indicated on the left and expressed in kDa. Raw, uncropped blots corresponding to (C) are shown in Supplementary Figure 2A-E; (D) Representative electron microscopy images of EV preparations used throughout the study. In D1, a TEM image of MSC-derived EVs, showing their characteristic size range and morphology (scale bar = 200 nm). In D2, a SEM image of MSC-derived EVs, showing their typical rounded morphology. CD63: Cluster of differentiation 63; EHT: extra high tension; EV: extracellular vesicle; GAPDH: glyceraldehyde-3-phosphate dehydrogenase; GFP: green fluorescent protein; kDa: kilodalton; KX: kilo-times; MSC: mesenchymal stromal cell; NTA: nanoparticle tracking analysis; SEM: scanning electron microscopy; TEM: transmission electron microscopy; UT: untransfected; WD: working distance.




