

fig4
From: Comprehensive and bias-aware analysis of small RNA NGS data for biomarker detection with caRNAge
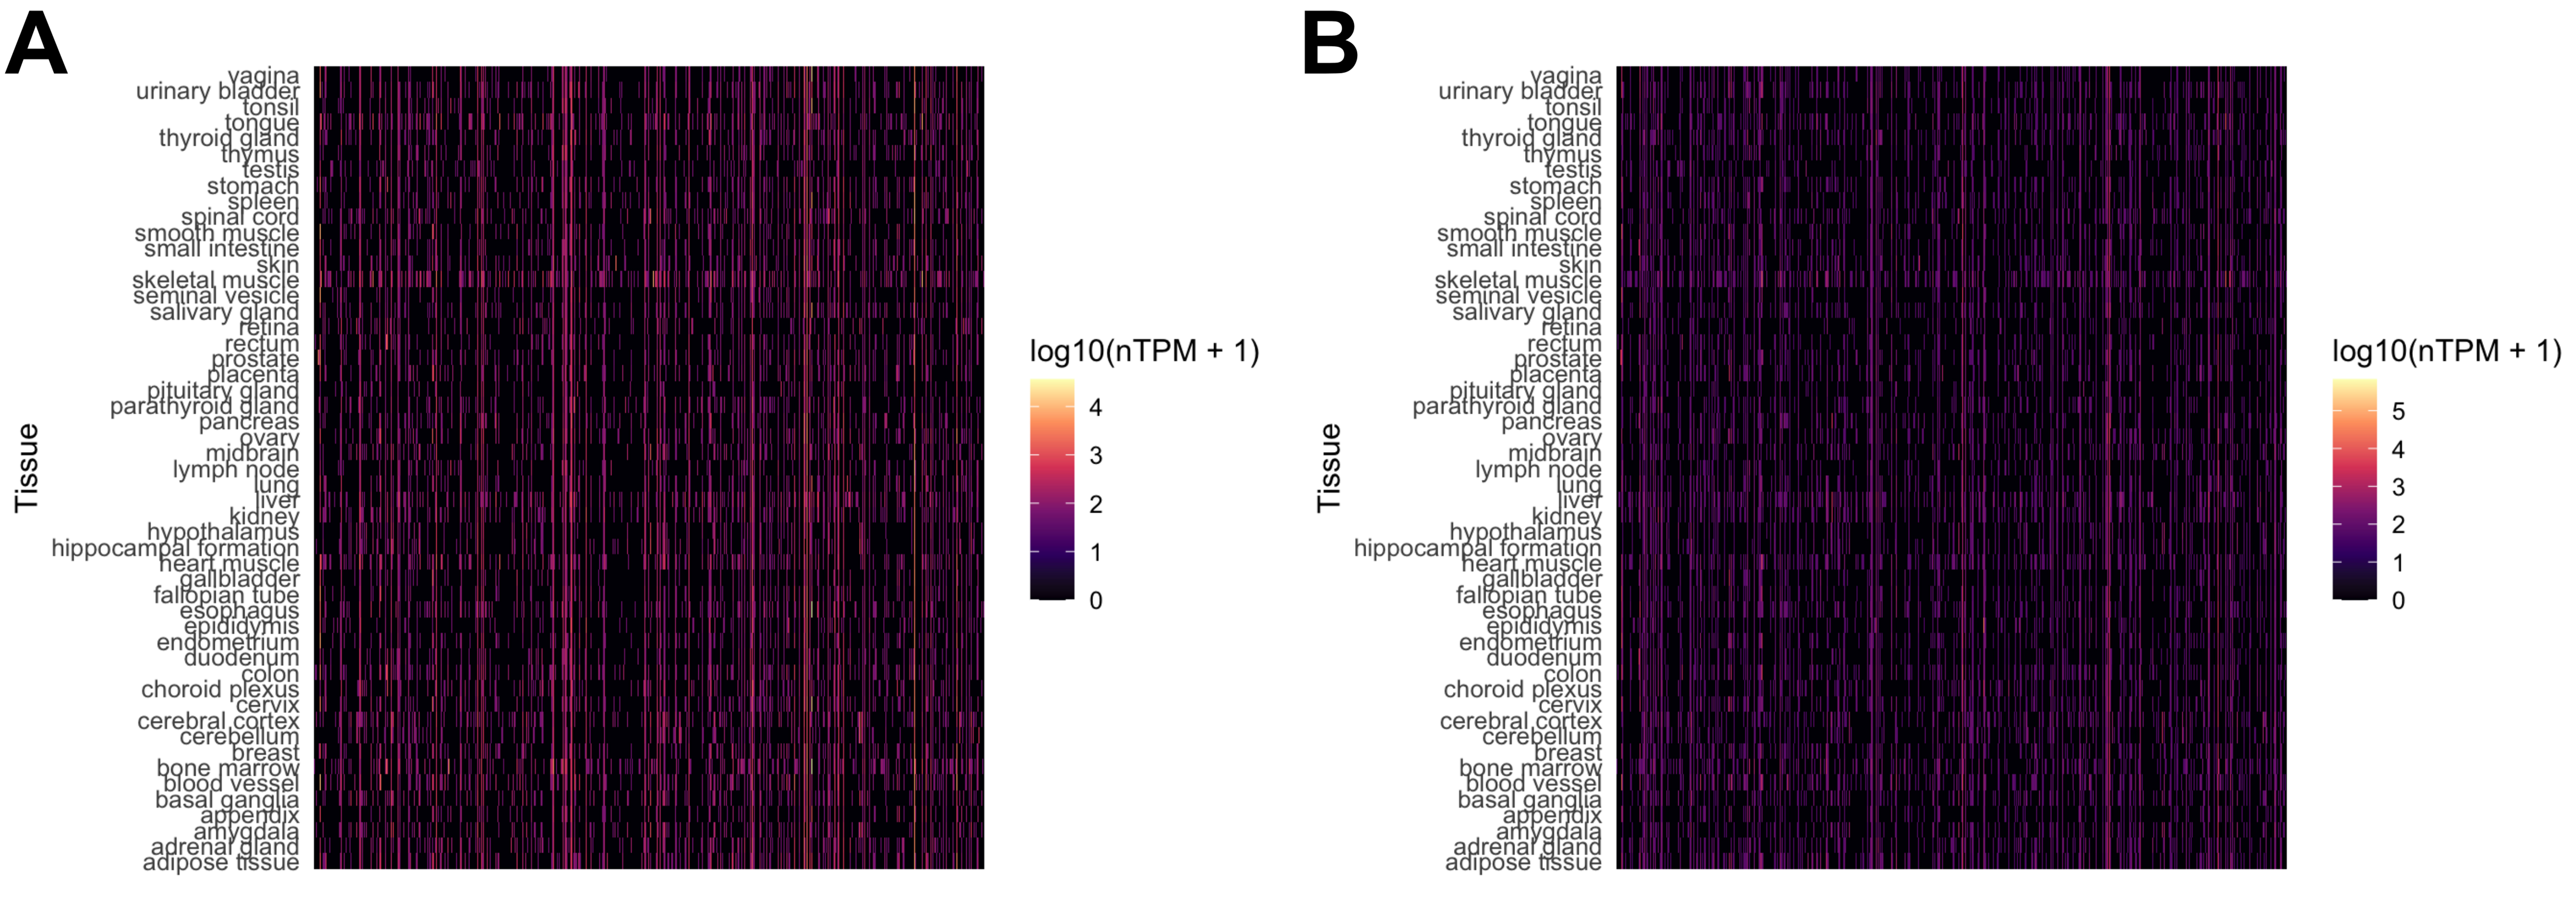
Figure 4. Tissue expression heatmaps of miRNA targets generated from the example dataset by caRNAge for the third report, using log10-transformed nTPM values, based on the DEGs for the two different treatments. (A) Isolation with manufacturer M; (B) Isolation with manufacturer Q. nTPM: Normalized transcripts per million.




