

fig3
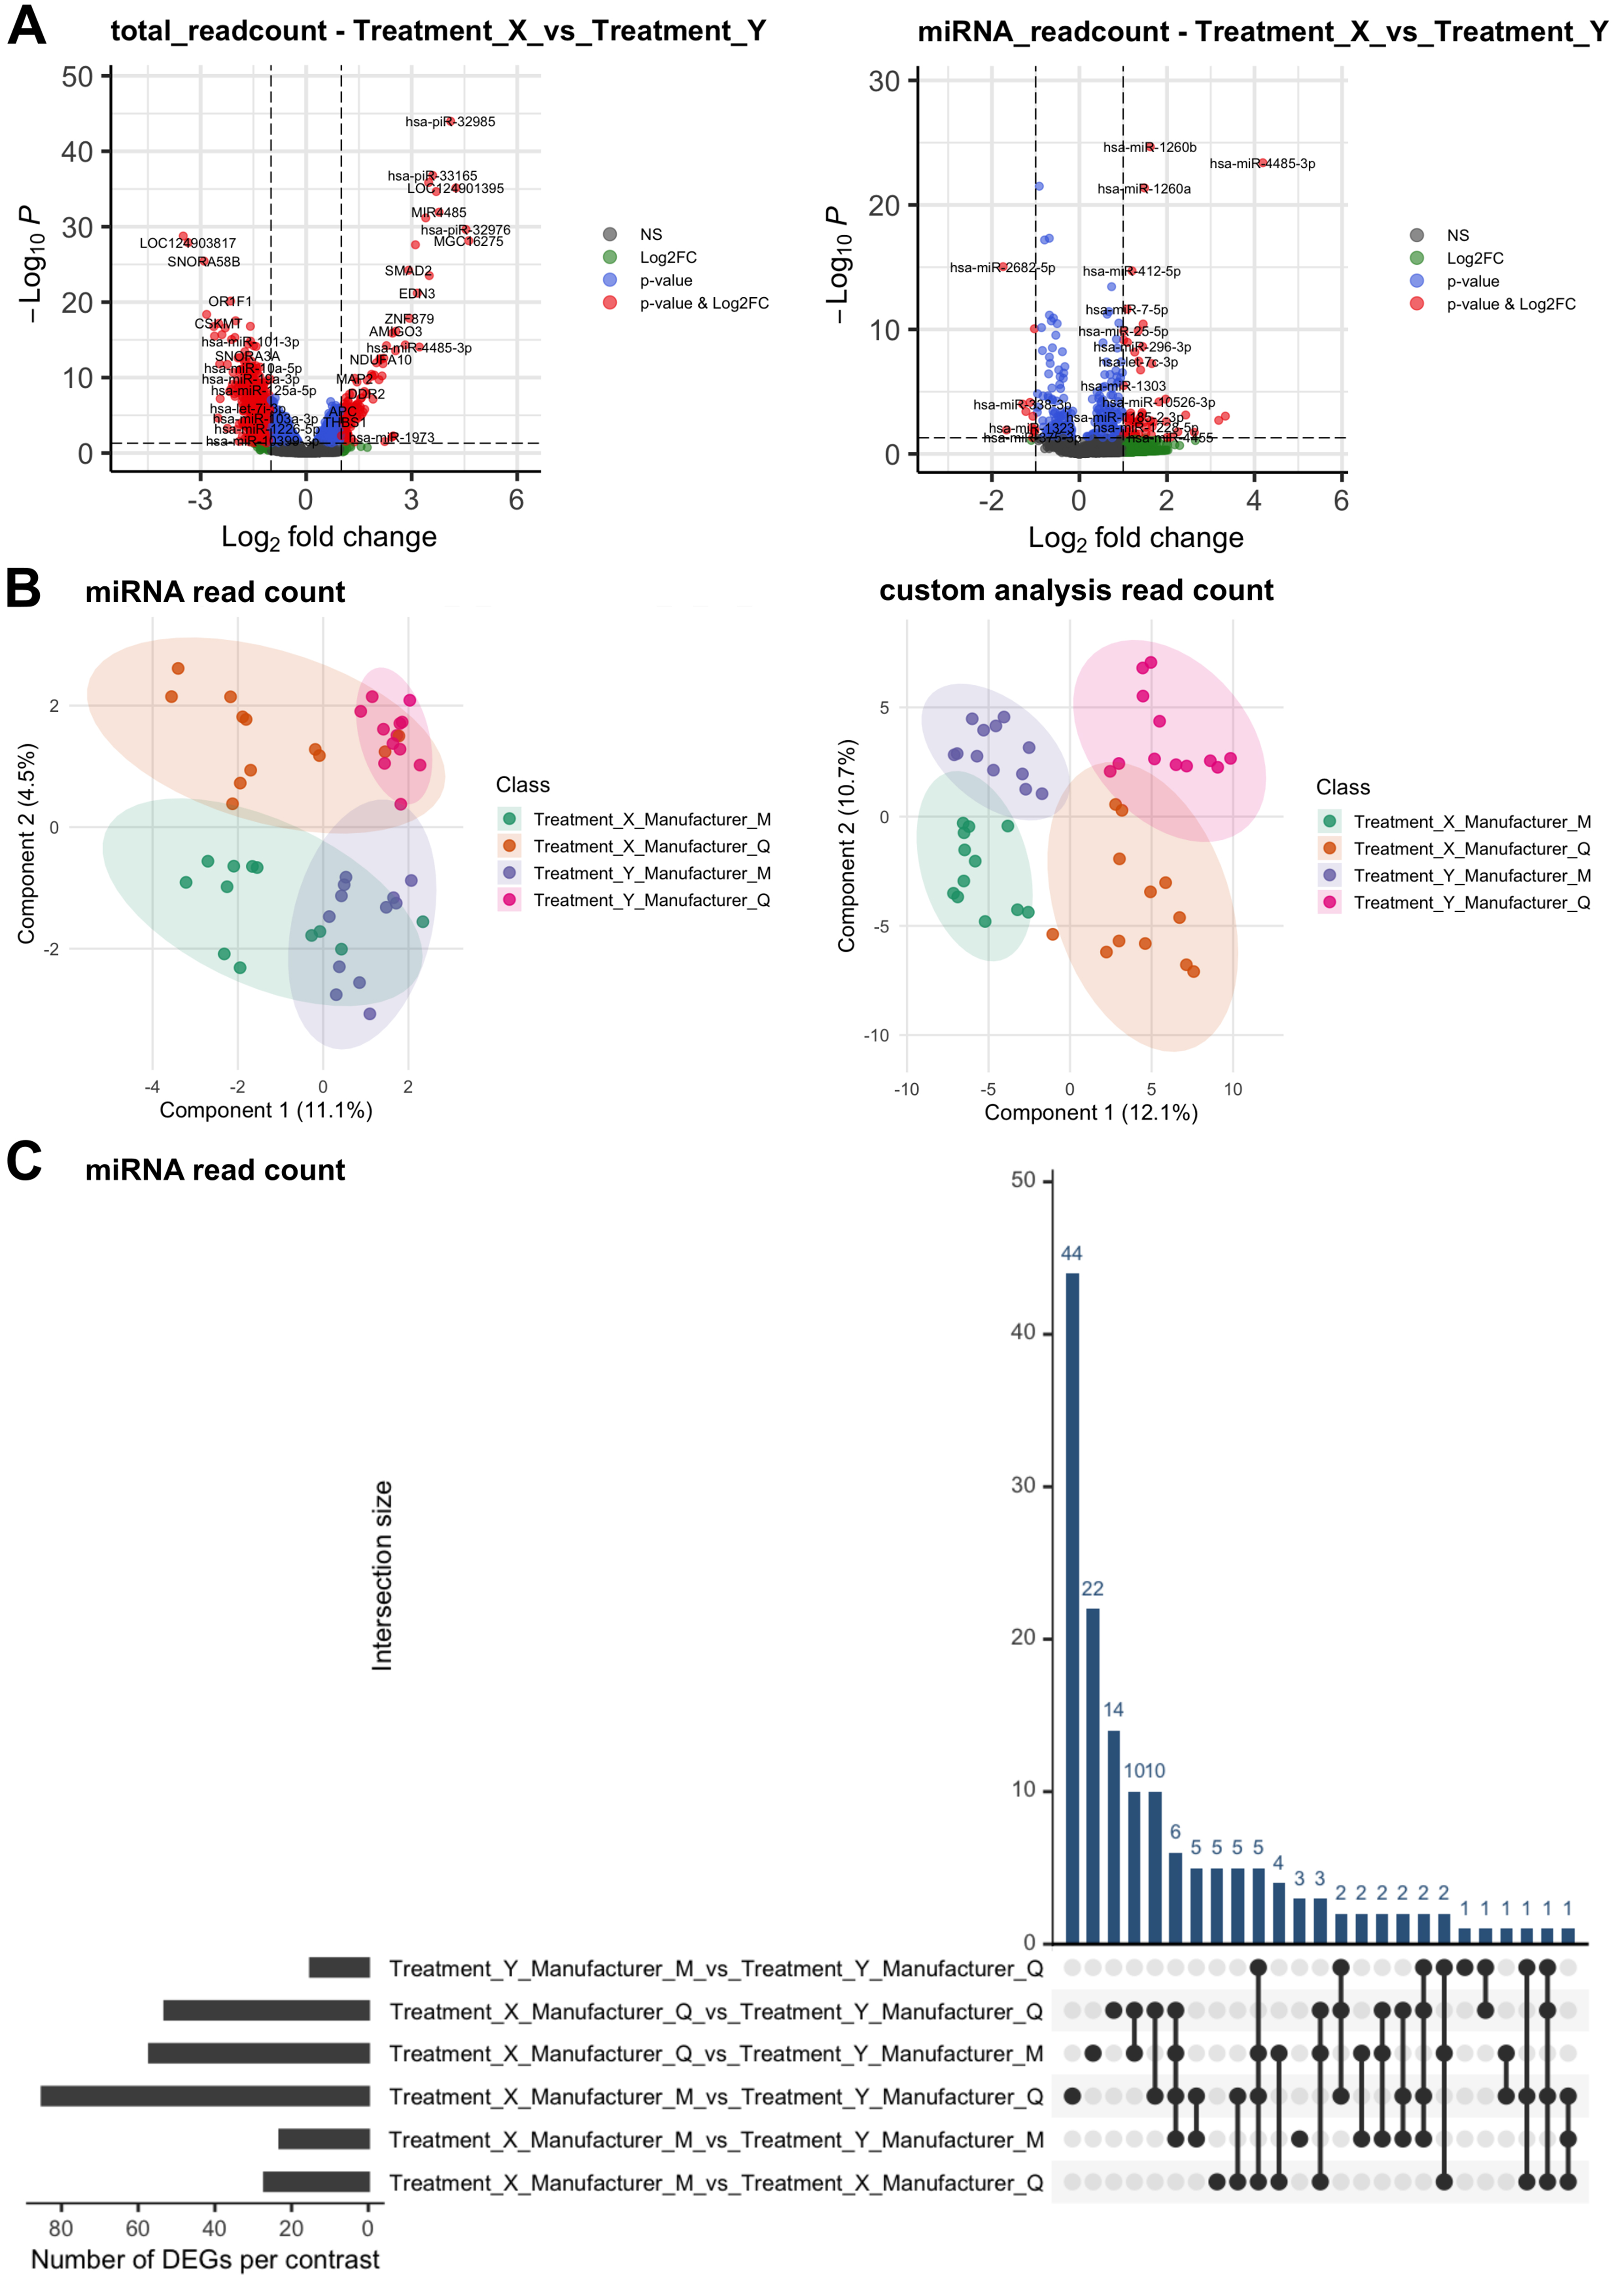
Figure 3. Differential expression and multivariate analysis results generated by caRNAge for the second report. (A) Volcano plots from the caRNAge DGE report for total read count analysis (left) and miRNA read count analysis (right). Features significant by padj only (≤ 0.05, -1 < log2FC < 1) are shown in blue, those meeting FC criteria only (|log2FC| ≥ 1, padj > 0.05) in green, and high-confidence DEGs meeting both criteria (padj ≤ 0.05, |log2FC| ≥ 1) in red; (B) Two-dimensional sPLS-DA plots from the caRNAge DGE report showing sample separation by treatment and EV isolation method, based on miRNA read count (left) and tRF read count analysis (right); (C) UpSet plot showing overlap and uniqueness of DEGs identified based on miRNA read count between the different treatment and EV isolation method combinations. DEGs: Differentially expressed genes; DGE: differential gene expression; FC: fold change; isomiR: miRNA isomer; miRNA: microRNA; NS: non-significant; padj: adjusted P-value; sPLS-DA: sparse partial least squares discriminant analysis; tRF: tRNA-derived fragment; tRNA: transfer RNA; EV: extracellular vesicle; NS: non-significant.




