

fig2
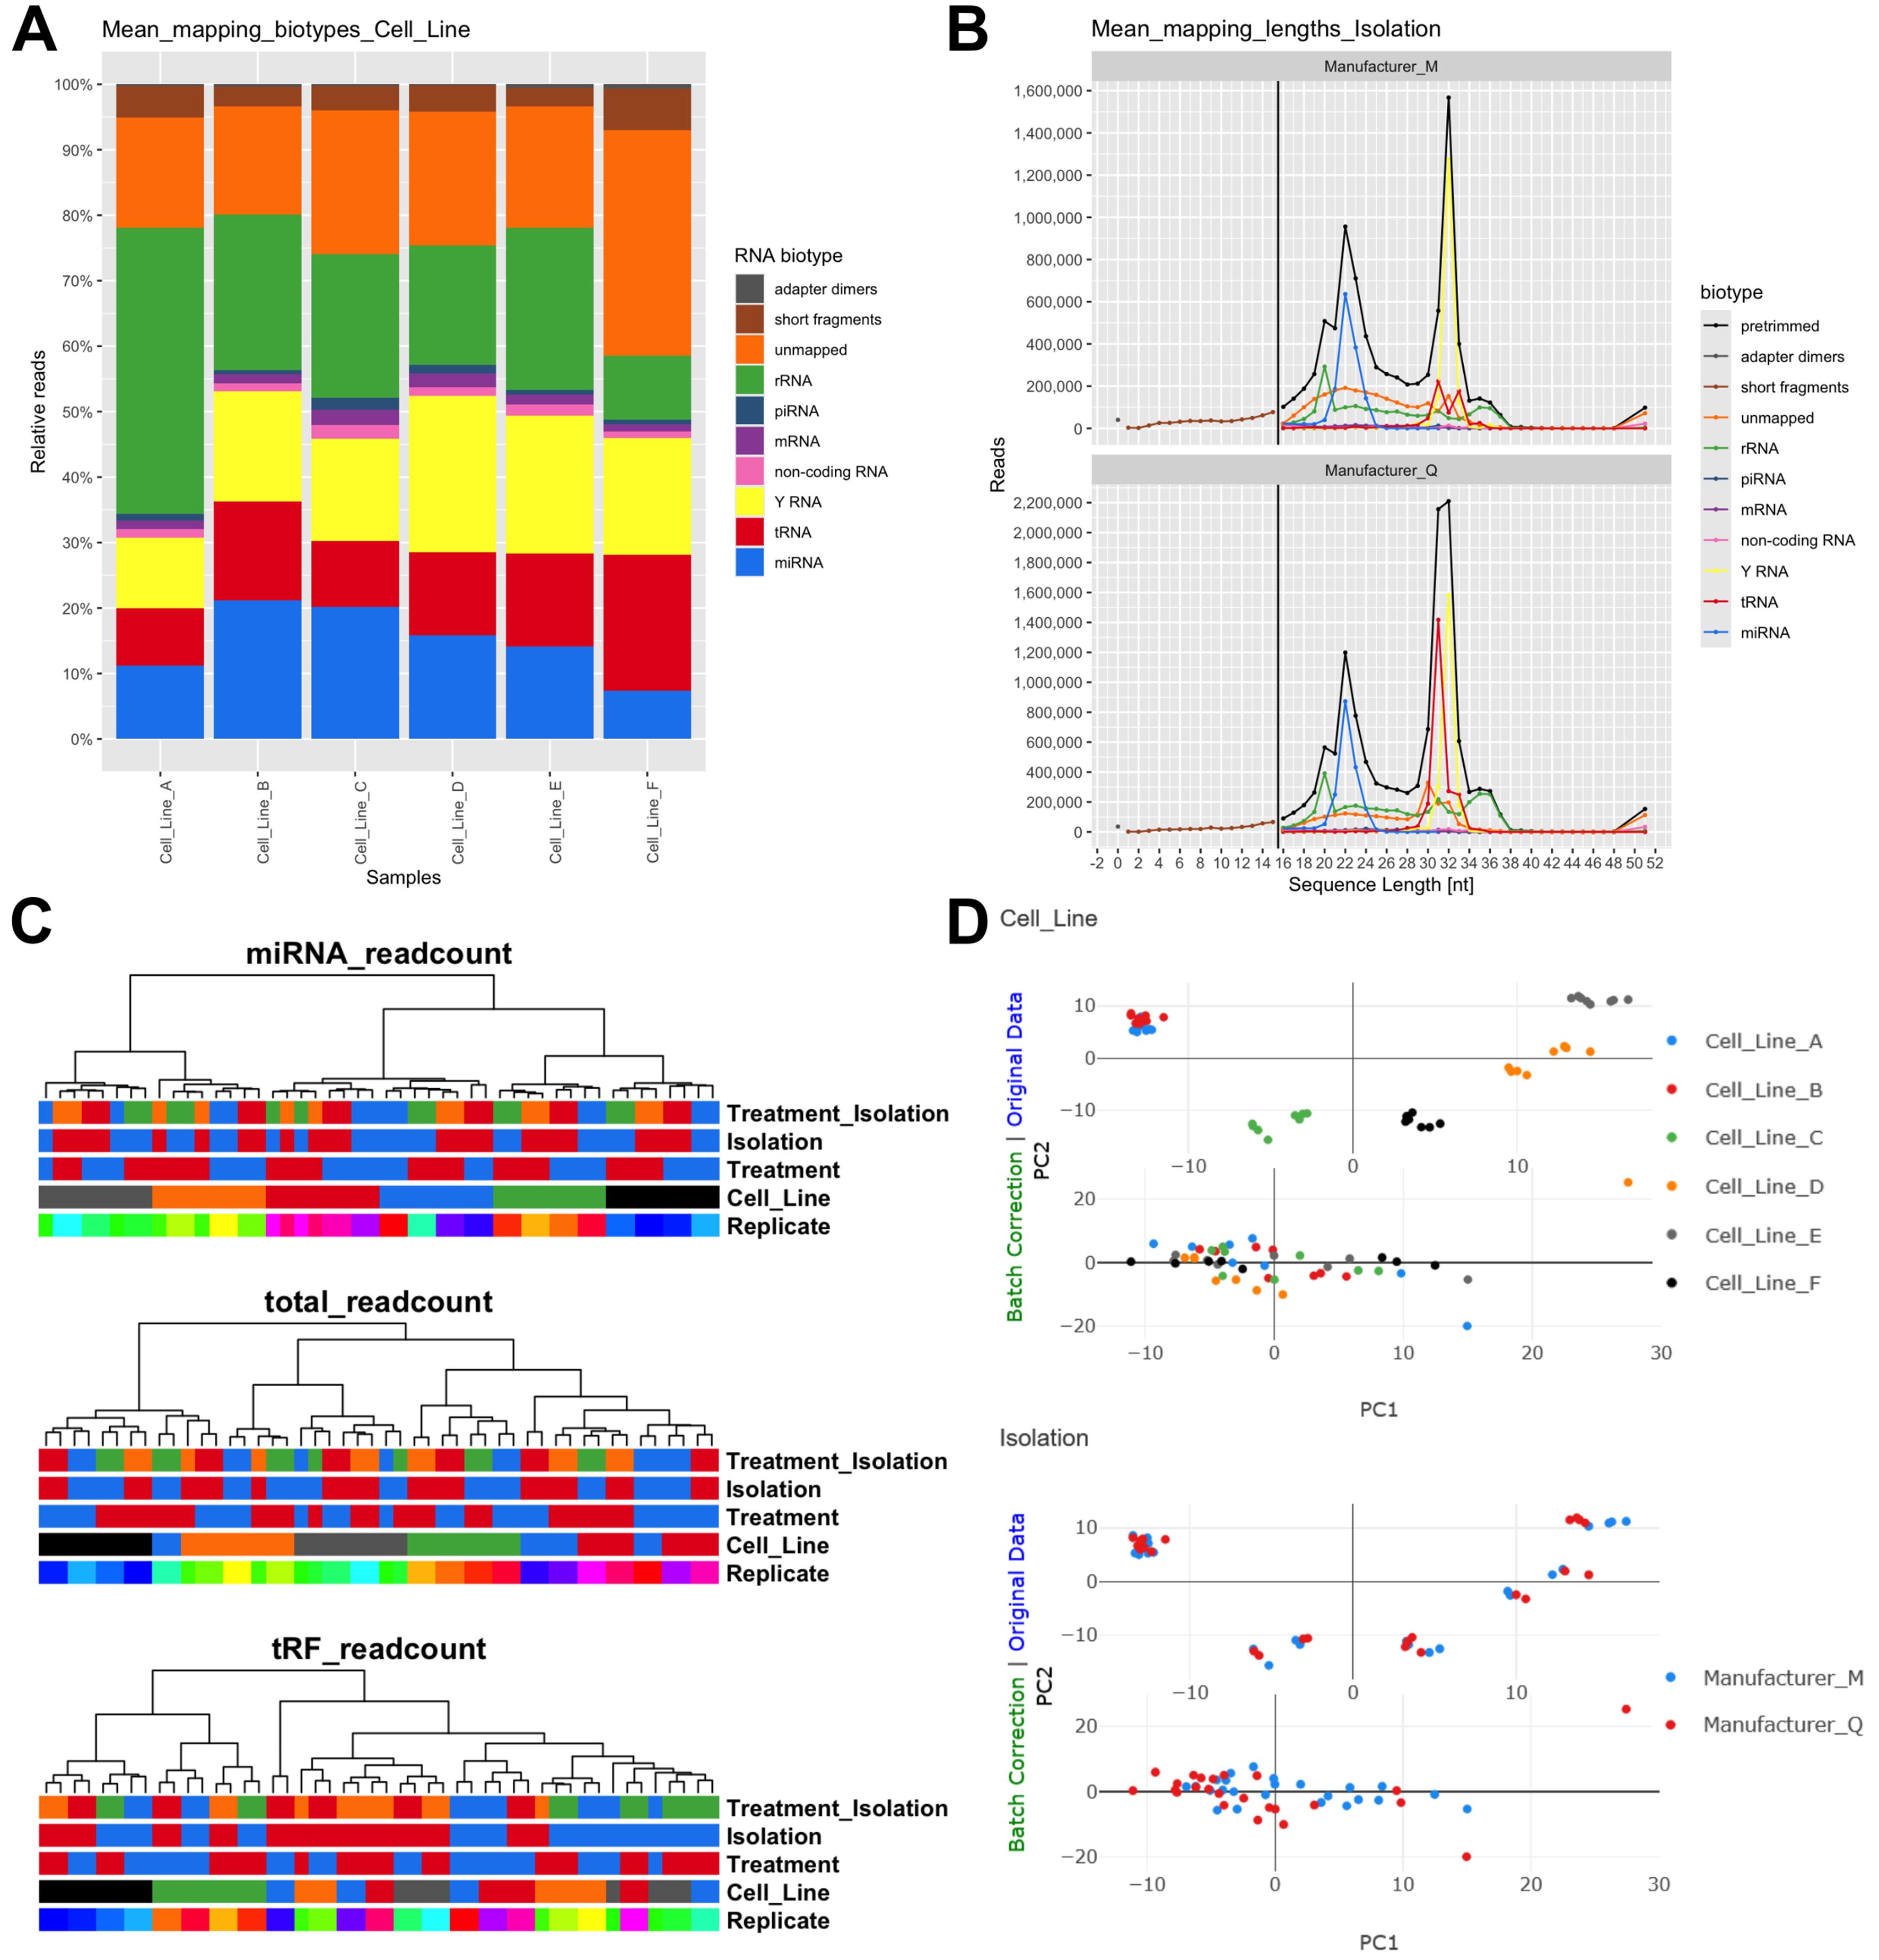
Figure 2. Overview of example output generated for the caRNAge overview report. (A) Relative read mapping distributions aggregated by cell line and stratified by RNA biotype; (B) Read mapping length distribution plots after adapter trimming, aggregated by EV isolation method and stratified by RNA biotype; (C) Excerpts of hierarchical clustering results showing dendrograms with the five associated metadata categories. Clusterings after normalization to miRNA read count (top), total read count (middle), and tRF read count (bottom) are shown; (D) Two-dimensional PCA (PC1 vs. PC2) illustrating sample separation before and after batch correction. The panels show PCAs computed from the 500 most variable features after miRNA read count normalization, with samples colored by cell line (top) and EV isolation method (bottom). EV: Extracellular vesicle; miRNA: microRNA; mRNA: messenger RNA; PC: principal component; PCA: principal component analysis; piRNA: piwi-interacting RNA; rRNA: ribosomal RNA; tRF: tRNA-derived fragment; tRNA: transfer RNA.




