

fig9
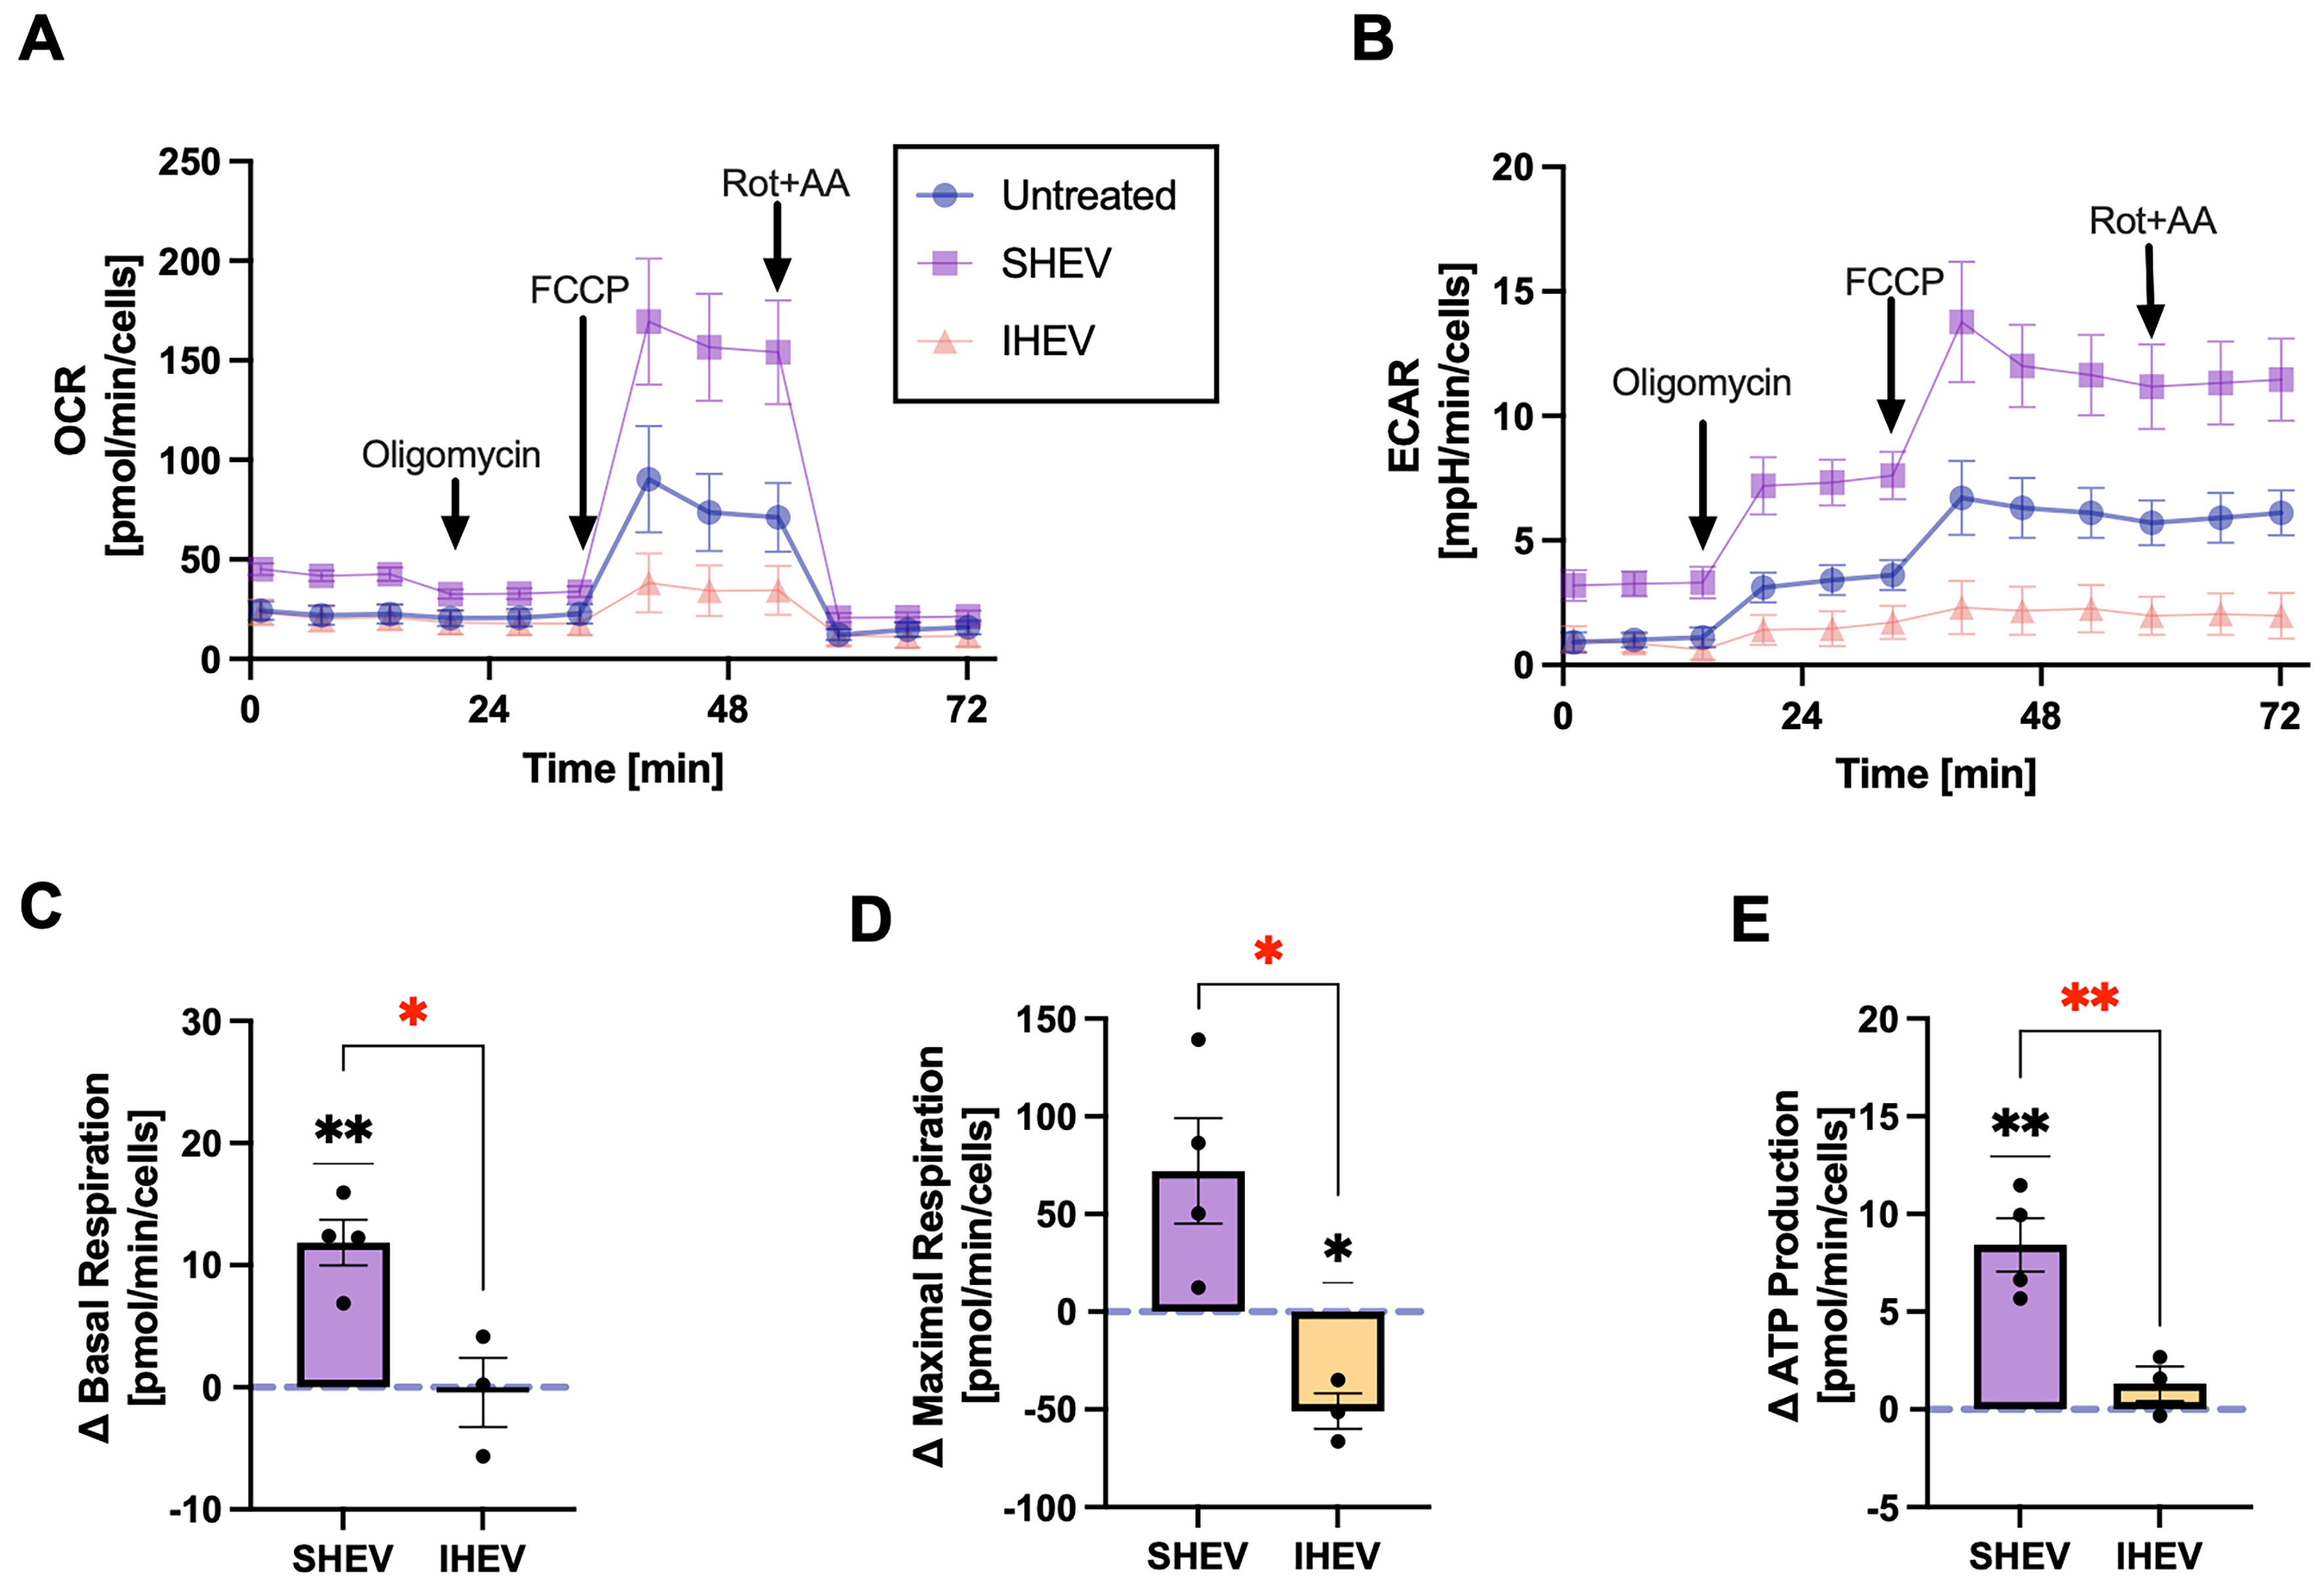
Figure 9. Effects of particle-normalized SHEV and IHEV treatment on cardiomyocyte mitochondrial bioenergetics. (A) OCR and (B) ECAR in untreated cardiomyocytes and cardiomyocytes treated with SHEVs or IHEVs. Arrows indicate substrate or inhibitor additions; (C) change in basal respiration; (D) maximal respiration; and (E) ATP production relative to the mean untreated response from the same NRVM preparation (Δ = EV-treated donor mean - untreated mean). SHEV and IHEV preparations were administered at 5 × 10⁸ particles/well, corresponding to approximately 1 × 10⁴ particles per plated cell. Each point in (C-E) represents one independently derived human EV donor preparation and is the mean of approximately five technical Seahorse wells (SHEV, n = 4 donor hearts; IHEV, n = 3 donor hearts). The dashed horizontal line at Δ = 0 represents the untreated NRVM reference. Donor-level Δ values were compared with zero using two-sided one-sample t-tests; black significance symbols indicate comparisons with untreated. SHEV vs. IHEV comparisons were performed using Welch’s unpaired t-test and are indicated by red significance symbols. *P < 0.05; **P < 0.01. Error bars indicate SEM. SHEV: Subsarcolemmal heart extracellular vesicle; IHEV: interfibrillar heart extracellular vesicle; OCR: oxygen consumption rate; ECAR: extracellular acidification rate; ATP: adenosine triphosphate; NRVM: neonatal rat ventricular myocyte; EV: extracellular vesicle; SEM: standard error of the mean.




