

fig8
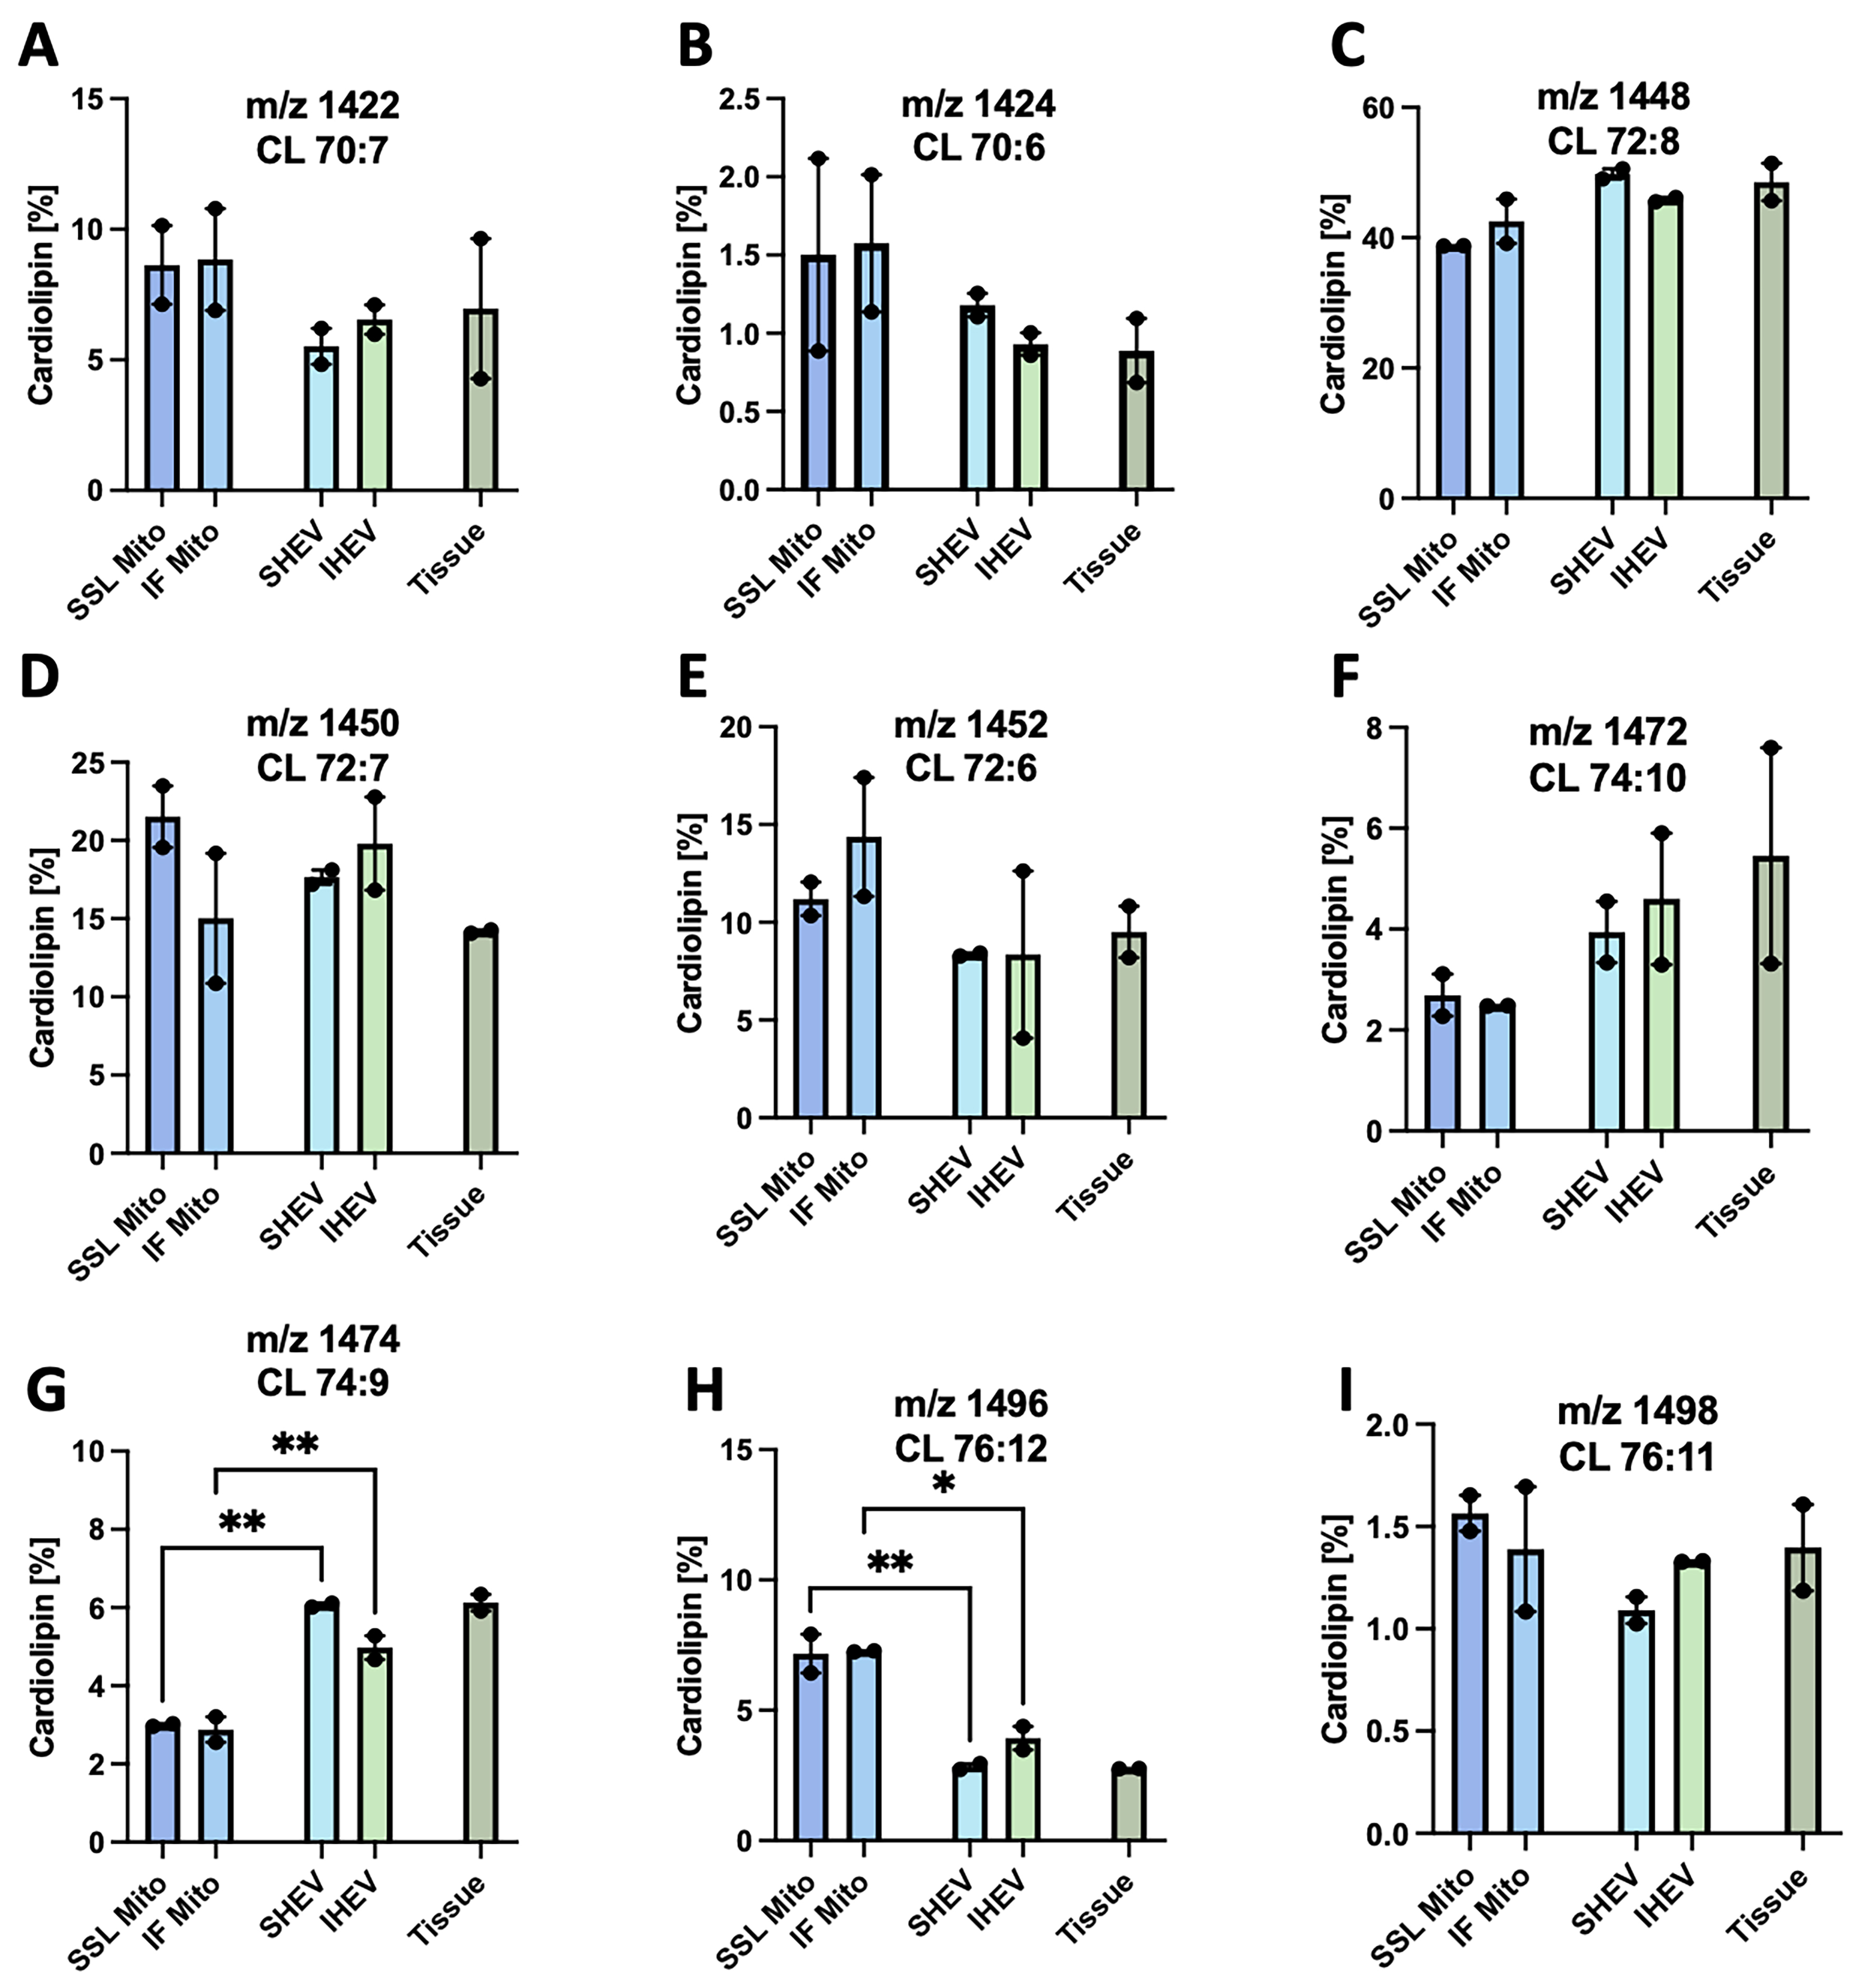
Figure 8. Percentage of individual CL species in SSL or IF mitochondria, SSL- or IF-associated heart EVs (SHEV, IHEV, respectively), or left ventricular tissue. Graphs show the percentage of the sum of the nine most prevalent CL species by mass/charge ratio (m/z) and number of side-chain carbons:double bonds for (A) 1422, 70:7; (B) 1424, 70:6; (C) 1448, 72:8; (D) 1450, 72:7; (E) 1452, 72:6; (F) 1472, 74:10; (G) 1474, 74:9; (H) 1496, 76:12; and (I) 1498, 76:11. *P < 0.05, **P < 0.01; N = 2 donor hearts. Because of the limited biological sample size (N = 2), these data are presented as exploratory/descriptive findings. Individual donor values are shown. Error bars show SEM. Analysis was performed using ordinary one-way ANOVA with multiple comparisons corrected using Tukey’s test. Comparisons in this dataset were SSL Mito vs SHEV, IF Mito vs IHEV, SHEV vs Tissue, and IHEV vs Tissue. CL: Cardiolipin; m/z: mass-to-charge; SSL: subsarcolemmal; IF: interfibrillar; EV: extracellular vesicle; SHEV: subsarcolemmal heart extracellular vesicle; IHEV: interfibrillar heart extracellular vesicle; SEM: standard error of the mean; ANOVA: analysis of variance.




