

fig6
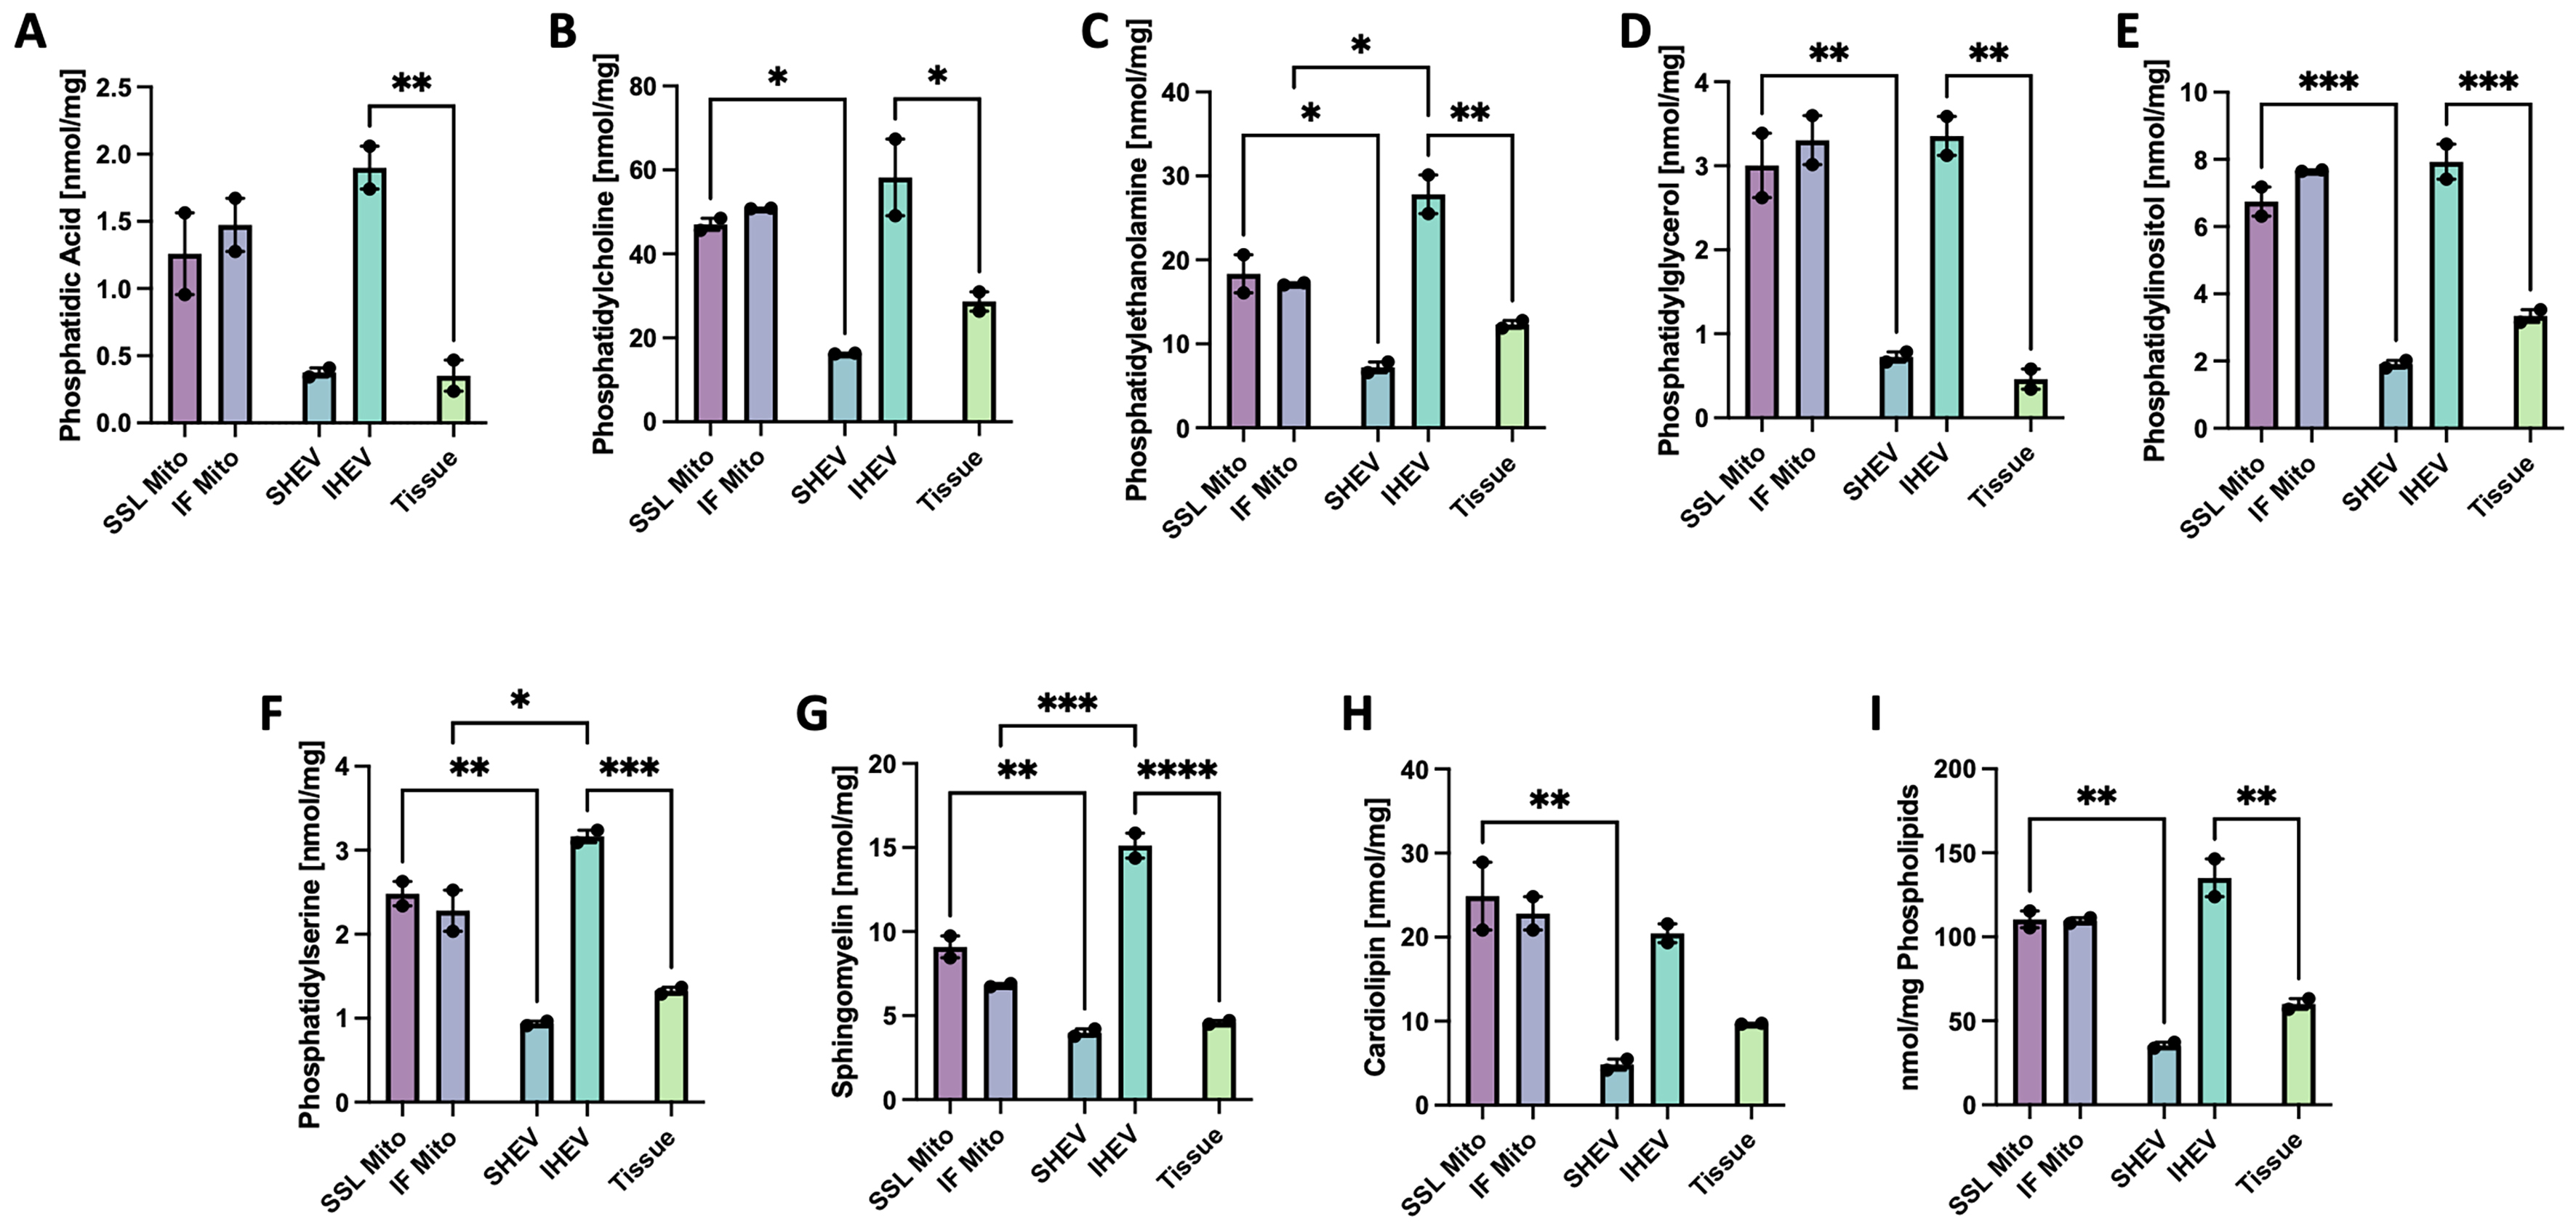
Figure 6. Absolute amounts in nmol/mg protein of eight phospholipid classes and their sum in SSL or IF mitochondria, SSL- or IF-associated heart EVs (SHEV and IHEV, respectively), or left ventricular tissue. Graphs show the sum of detected species for (A) PA, (B) PC, (C) PE, (D) PG, (E) PI, (F) PS, (G) SM, (H) CL, and (I) sum of all phospholipid species. *P < 0.05, **P < 0.01, ***P < 0.001, ****P < 0.0001; N = 2 donor hearts. Because of the limited biological sample size (N = 2), these data are presented as exploratory/descriptive findings. Individual donor values are shown. Error bars show SEM. Analysis was performed using ordinary one-way ANOVA with multiple comparisons corrected using Tukey’s test. Comparisons in this dataset were SSL Mito vs. SHEV, IF Mito vs. IHEV, SHEV vs. Tissue, and IHEV vs. Tissue. SSL: Subsarcolemmal; IF: interfibrillar; EV: extracellular vesicle; SHEV: subsarcolemmal heart extracellular vesicle; IHEV: interfibrillar heart extracellular vesicle; PA: phosphatidic acid; PC: phosphatidylcholine; PE: phosphatidylethanolamine; PG: phosphatidylglycerol; PI: phosphatidylinositol; PS: phosphatidylserine; SM: sphingomyelin; CL: cardiolipin; SEM: standard error of the mean; ANOVA: analysis of variance.




