

fig5
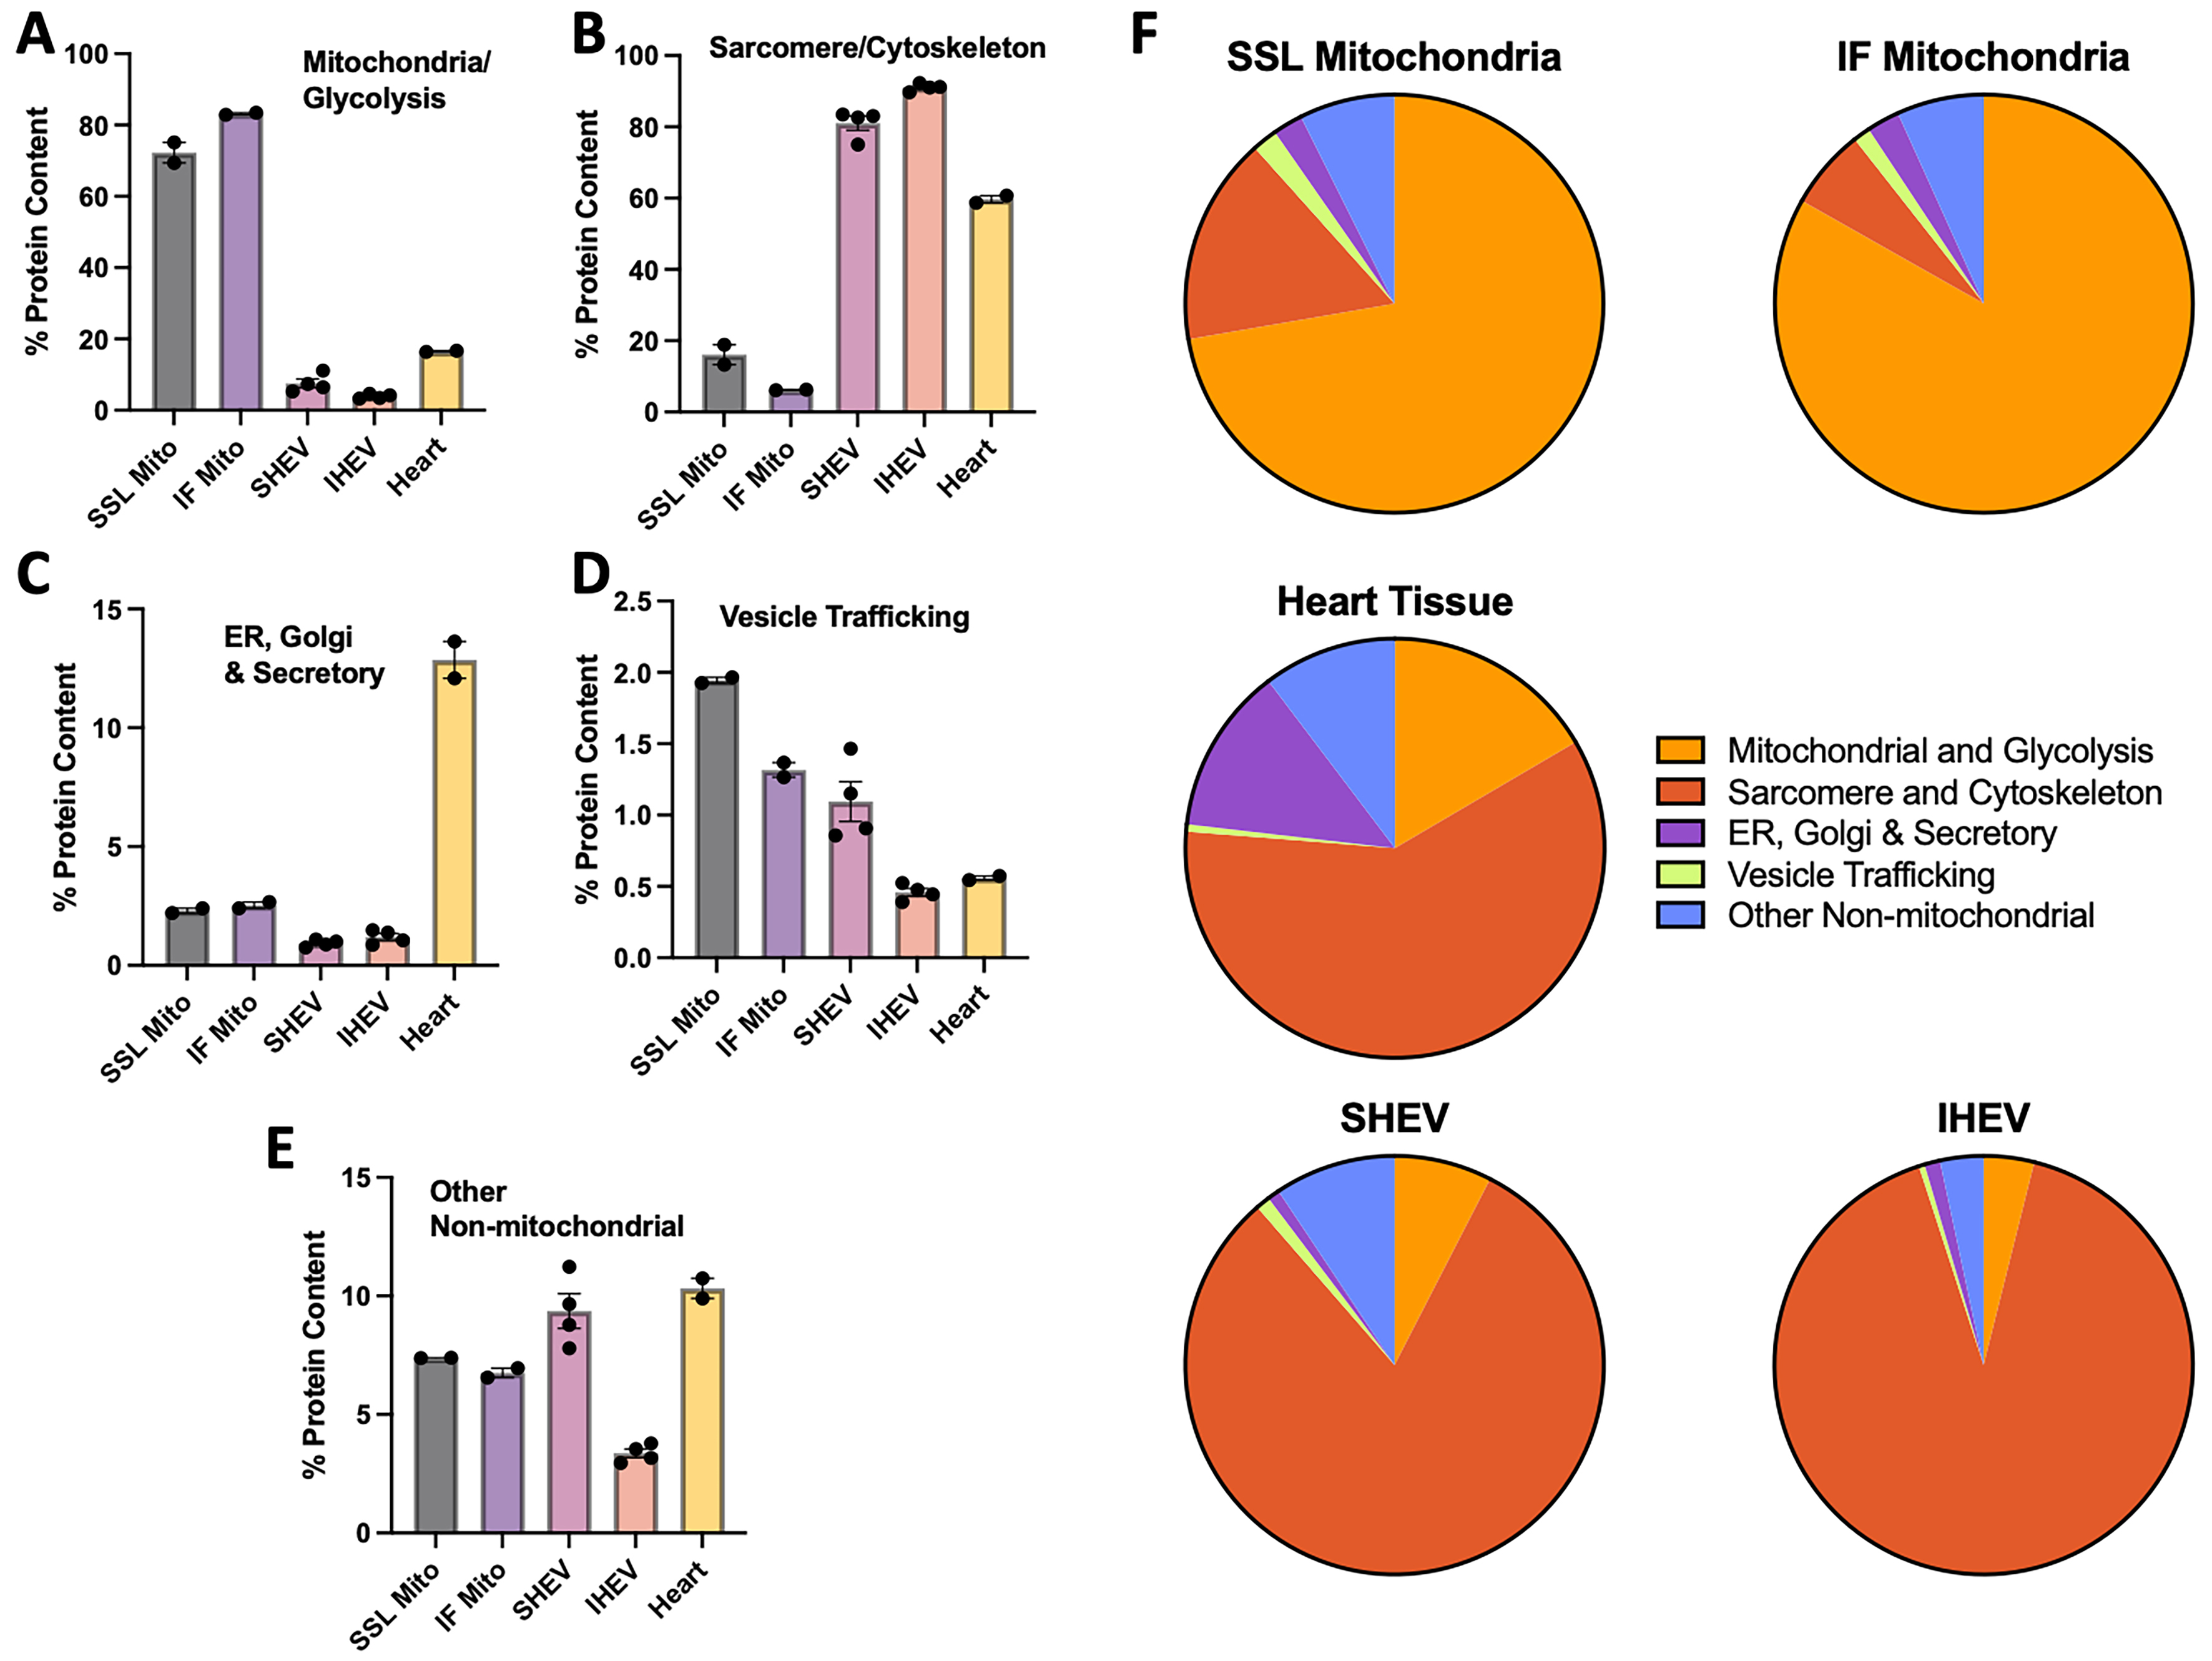
Figure 5. Proteins categorized by function. Percentage of detected proteins by function: (A) mitochondrial and glycolysis proteins; (B) sarcomere and cytoskeletal proteins; (C) ER, Golgi, and secretory proteins; (D) vesicular trafficking proteins; (E) other non-mitochondrial proteins; (F) fractional amounts for each protein function category by sample type, representing the average of two separate mitochondrial and tissue samples and four separate EV samples. Functional categories are shown in the legend by separate colors. N = 2-4 hearts. Error bars show SEM. Statistical differences in (A-E) were assessed using ordinary one-way ANOVA with multiple comparisons corrected using Tukey’s test. Complete results are provided in Supplementary Table 2. ER: Endoplasmic reticulum; EV: extracellular vesicle; SSL: subsarcolemmal; IF: interfibrillar; SHEV: subsarcolemmal heart extracellular vesicle; IHEV: interfibrillar heart extracellular vesicle; SEM: standard error of the mean; ANOVA: analysis of variance.




