

fig5
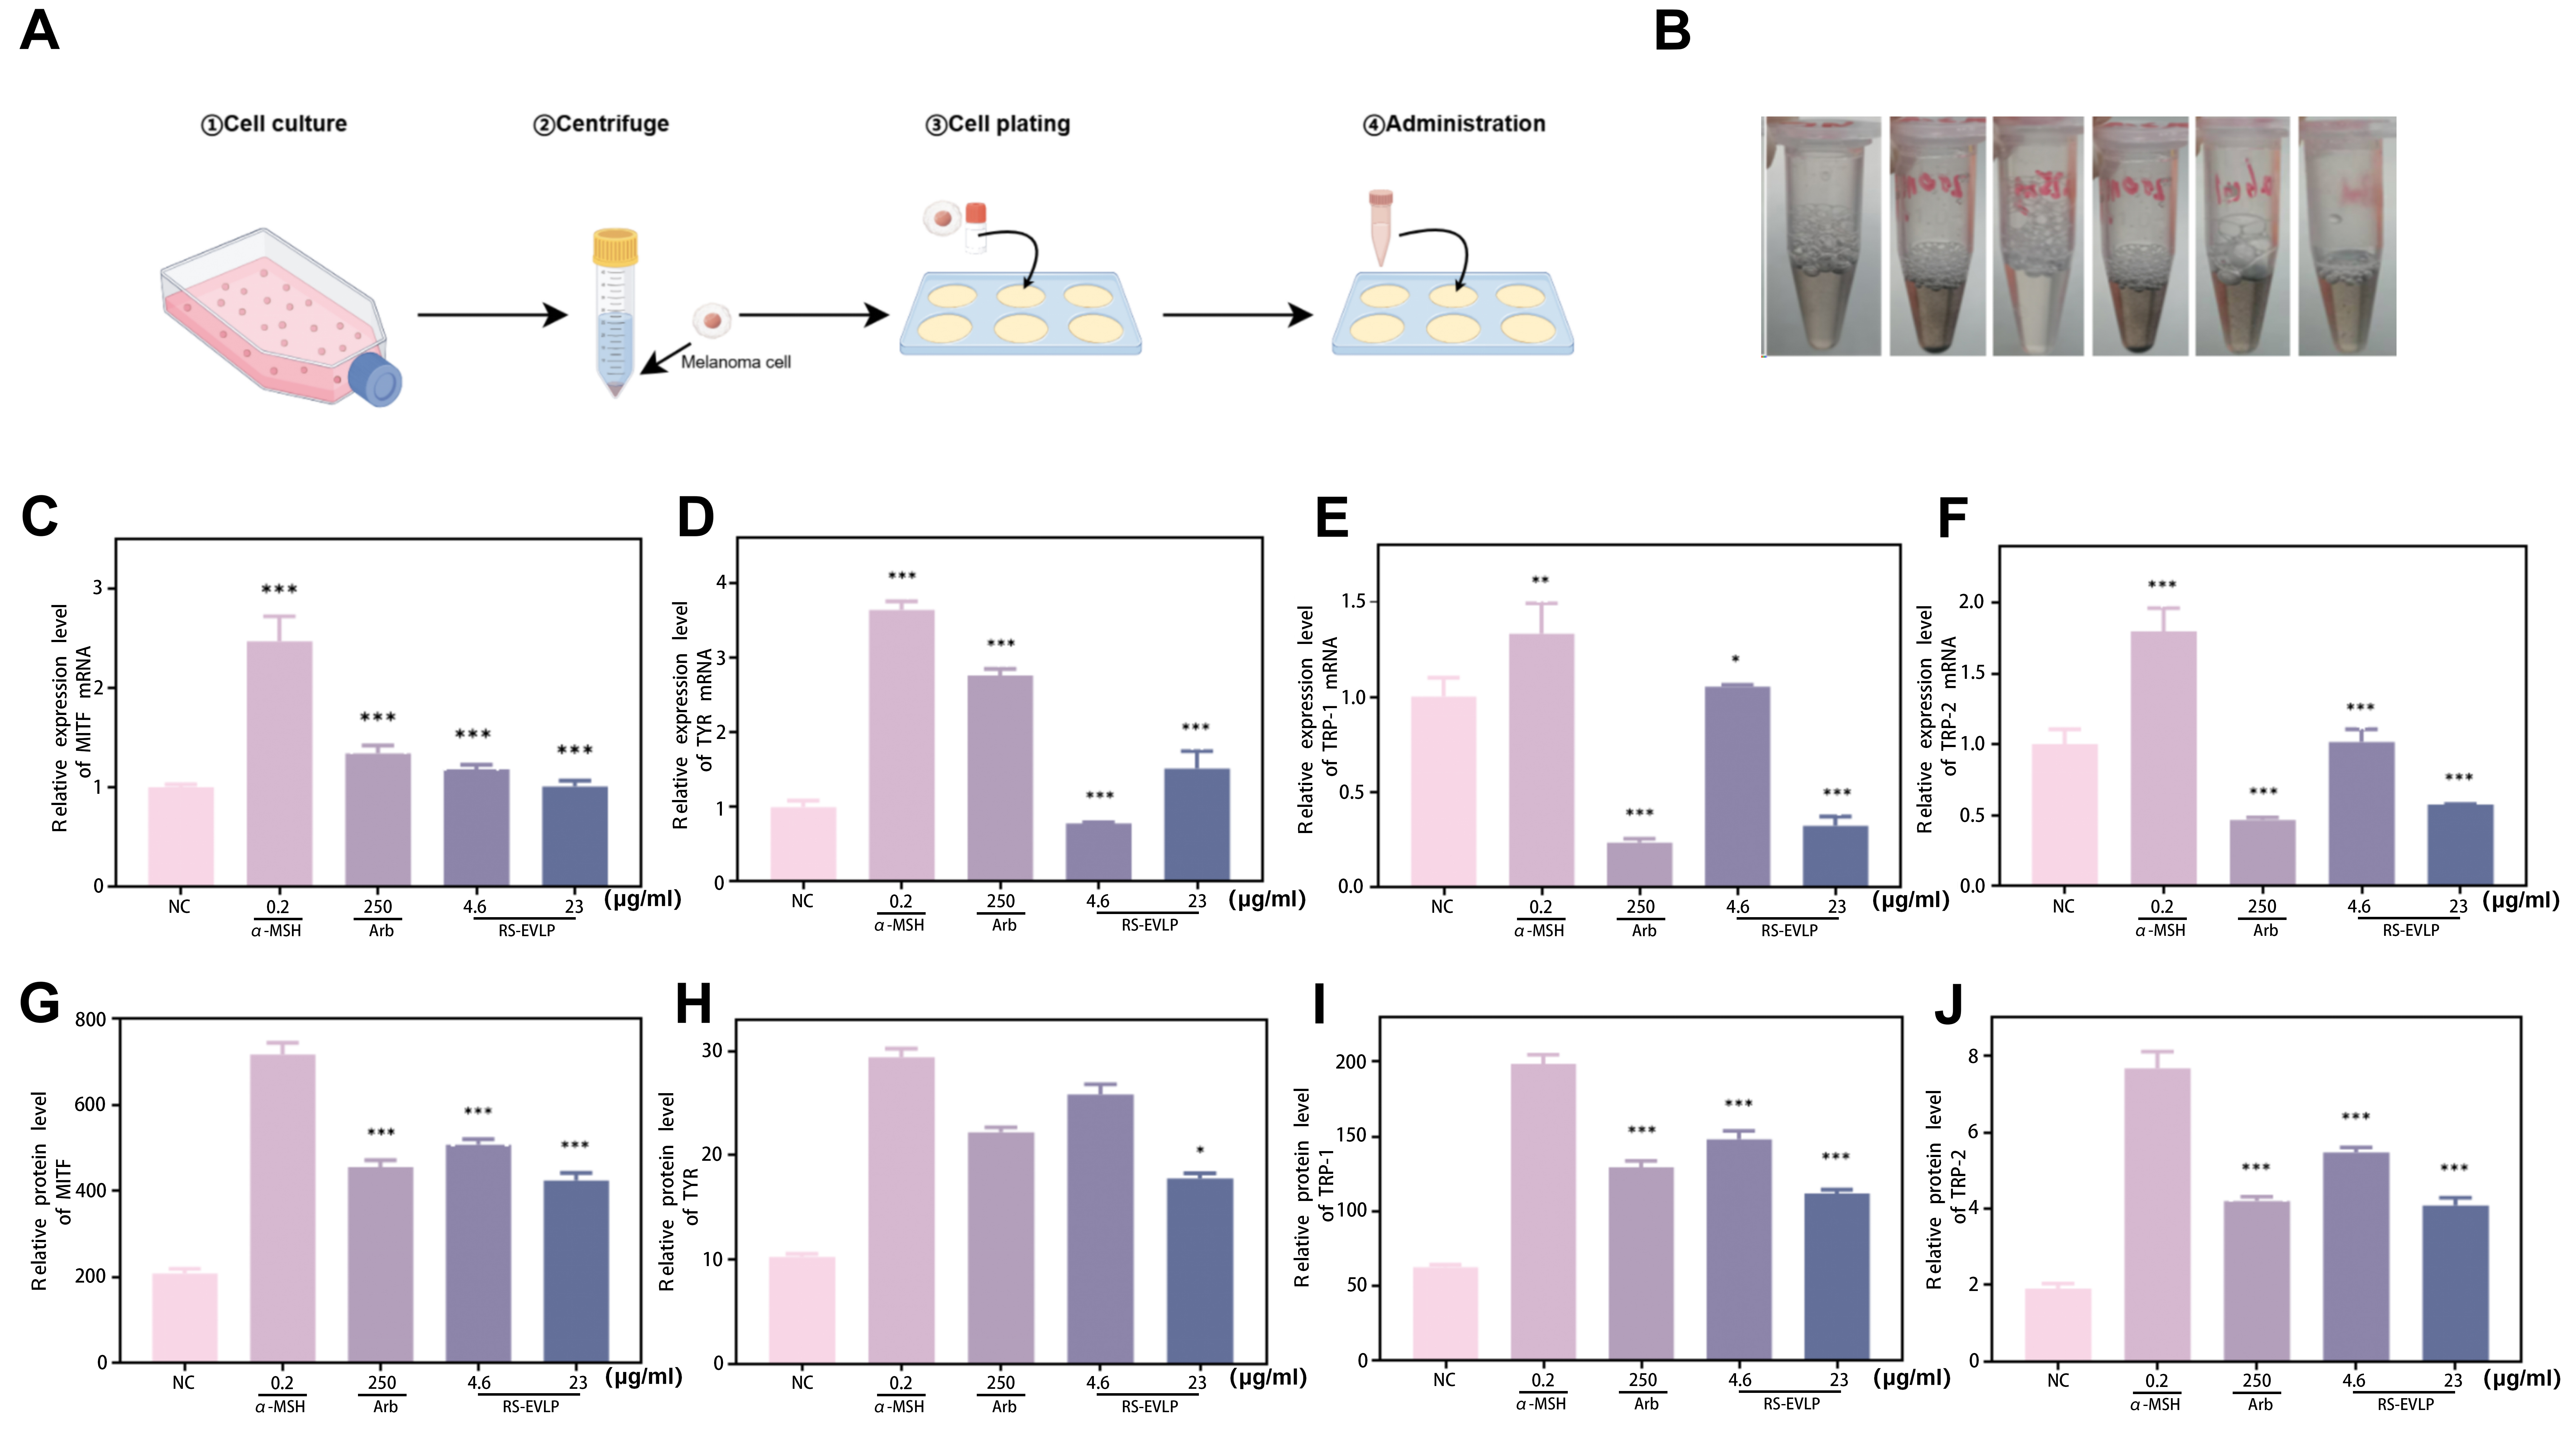
Figure 5. Regulatory effects of RS-EVLP on the expression of key melanogenesis pathway genes and proteins in B16 cells. (A) Cells were cultured and treated with compounds (α-MSH, arbutin, or RS-EVLP at 4.6 and 23 µg/mL); (B) Representative photographs of cell pellets harvested from each treatment group; (C-F) RT-qPCR analysis of the effect of different concentrations of RS-EVLP on the expression of coregulated genes (4.6 and 23 µg/mL) of RS-EVLP-treated B16 cells for 48 h; (G-J) ELISA analysis of the regulatory effects of RS-EVLP on key proteins [(G) MITF; (H) TYR; (I) TRP-1; and (J) TRP-2]. Data are expressed as the mean ± SEM from three independent biological replicates (n = 3). Statistical significance was determined by one-way ANOVA followed by Tukey’s multiple comparisons test (vs. control group): *P < 0.05; **P < 0.01; ***P < 0.001. ANOVA: Analysis of variance; α-MSH: α-melanocyte-stimulating hormone; ELISA: enzyme-linked immunosorbent assay; MITF: microphthalmia-associated transcription factor; RS-EVLP: rose-derived extracellular vesicle-like particles; RT-qPCR: reverse transcription quantitative polymerase chain reaction; SEM: standard error of the mean; TRP-1: tyrosinase-related protein 1; TRP-2: tyrosinase-related protein 2; TYR: tyrosinase.




