

fig1
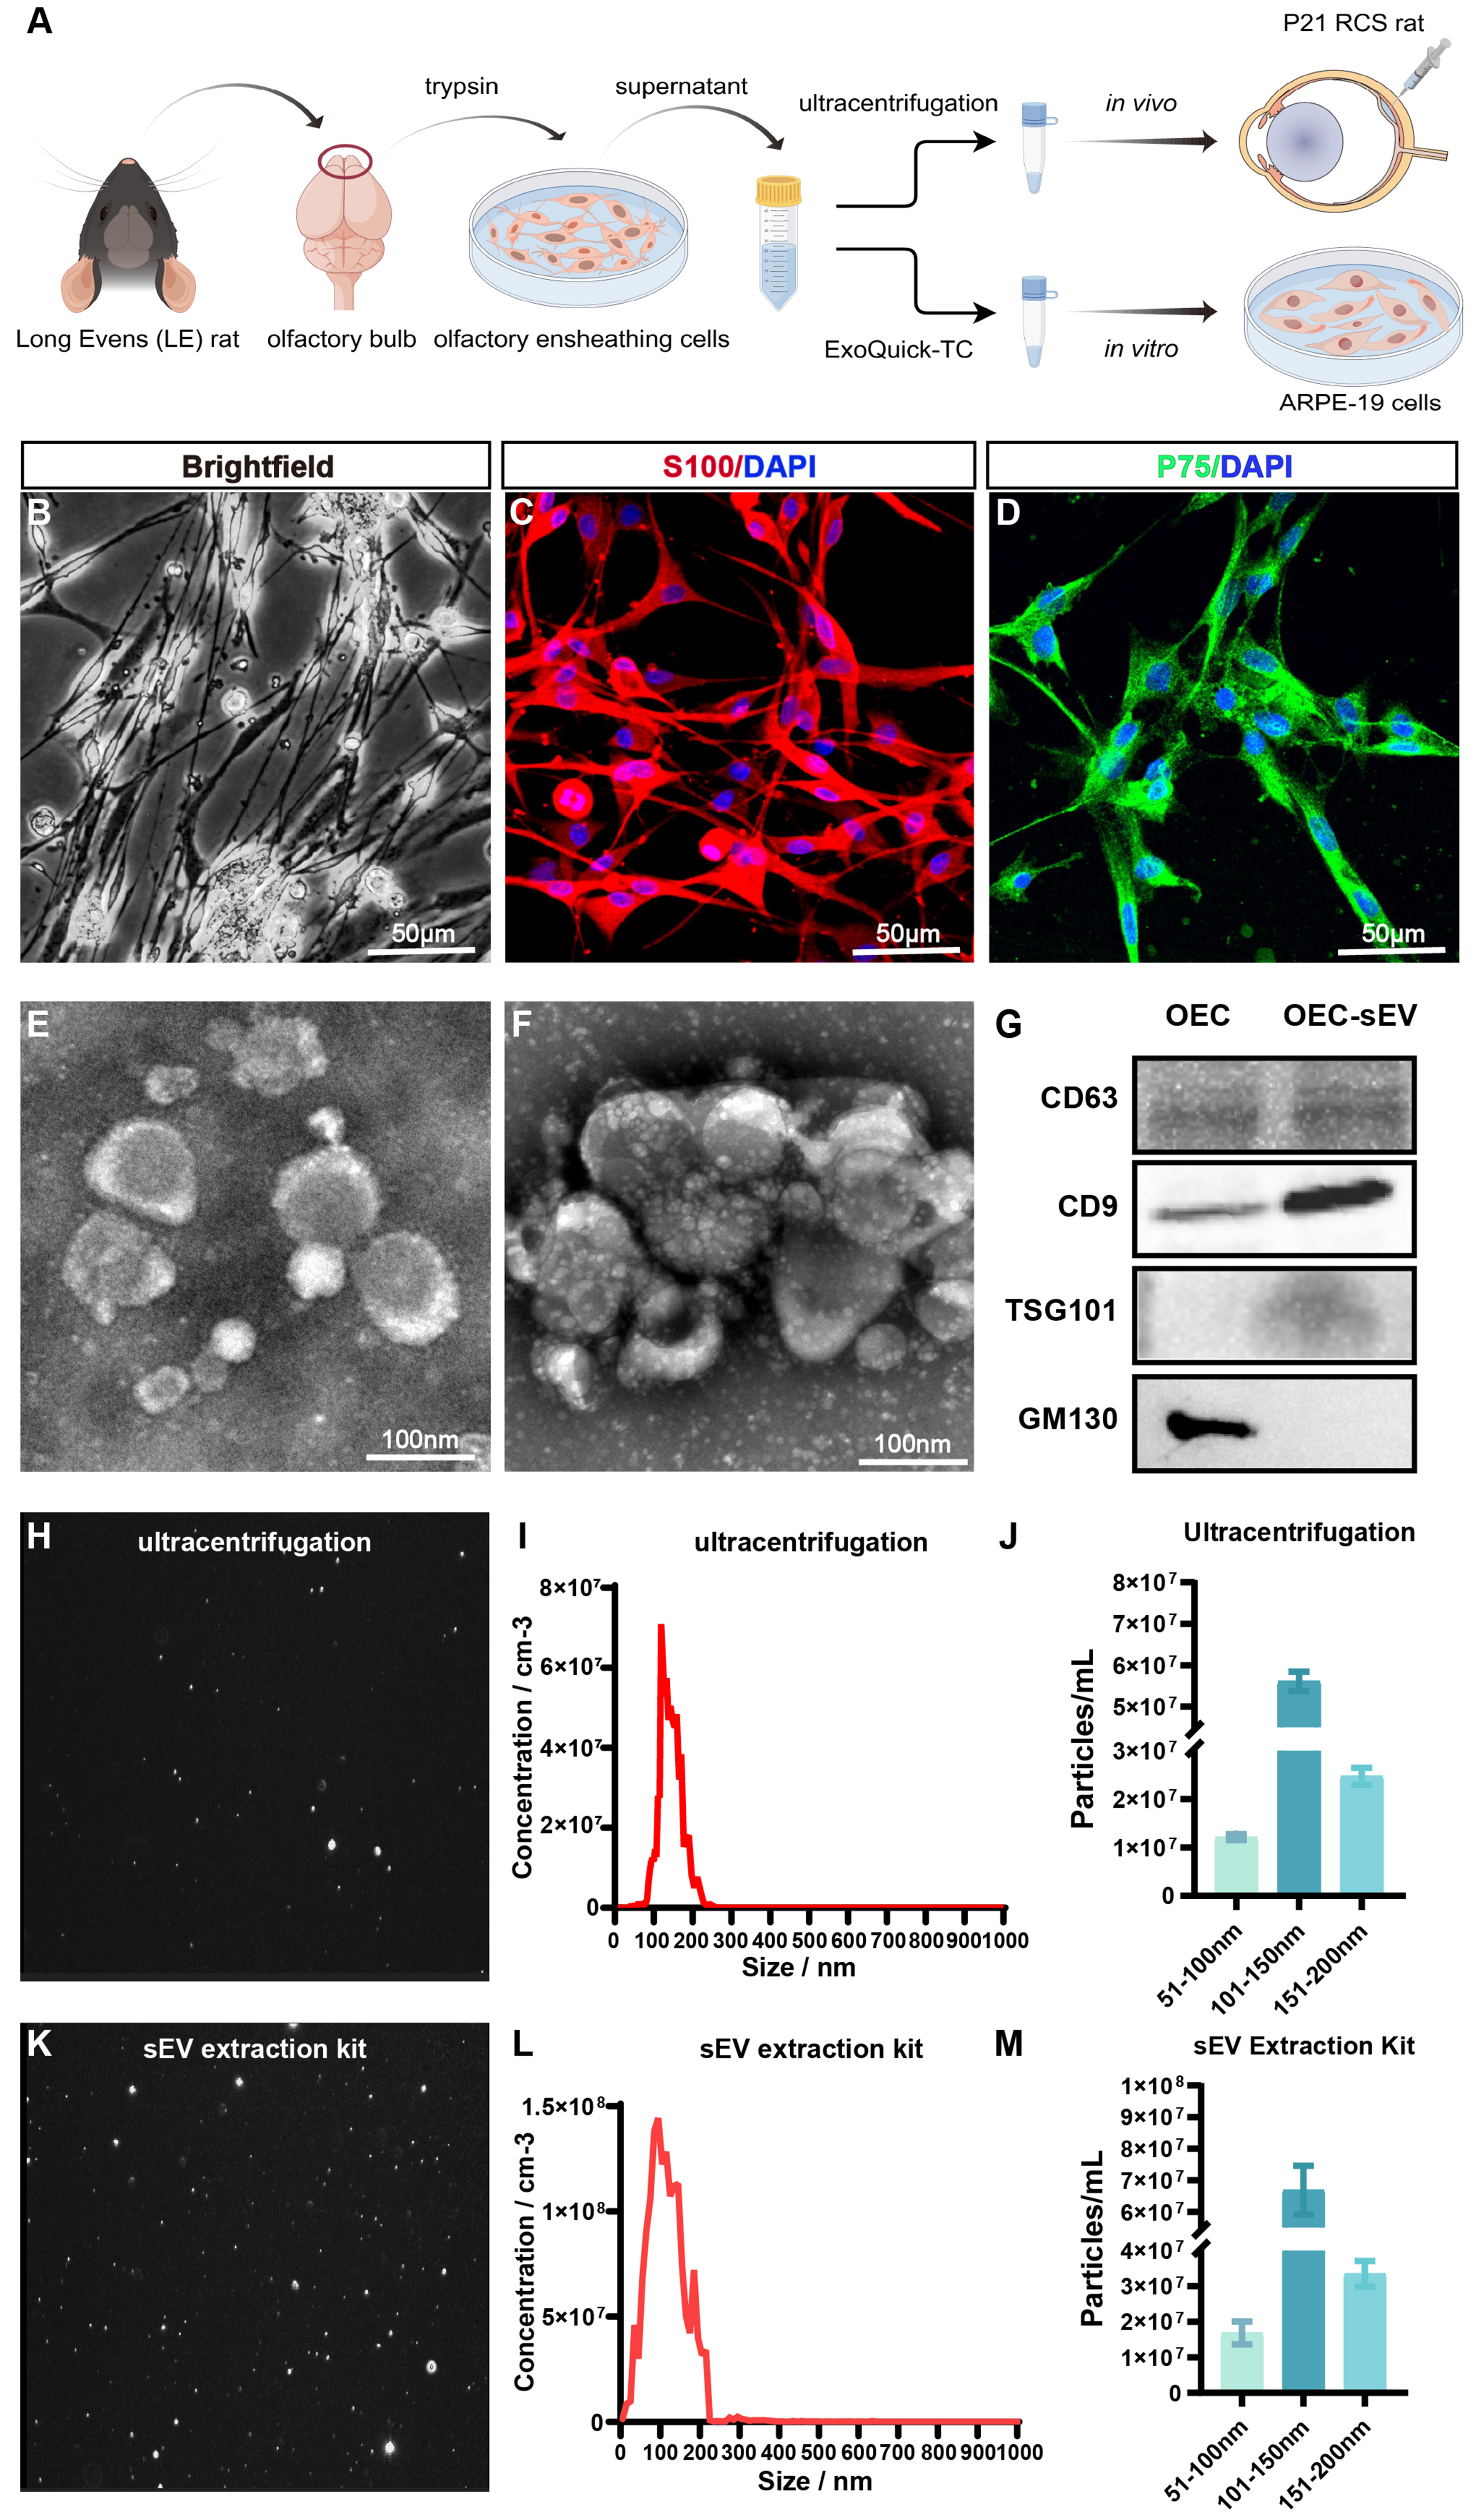
Figure 1. Characterization of OEC-derived sEVs. (A) Schematic of in vivo and in vitro experiments. Created on www.figdraw.com (Copyright Code: SASSR444de); (B) Representative light microscopy image showing the typical morphology of OECs. Scale bars = 50 μm; (C and D) Immunofluorescence staining of OEC-specific markers S100 (green), P75 (red), and DAPI (blue). Scale bars = 50 μm; (E and F) TEM images of sEVs isolated via ultracentrifugation (E) and ExoQuick-TC (F). Scale bars = 100 nm; (G) Western blot analysis confirms the expression of positive and negative markers for sEVs (CD63, CD9, TSG101, GM130) in both OECs and OEC-sEVs isolated by ultracentrifugation. n = 3 biologically independent OEC cultures and OEC-sEV preparations. The images shown are representative of three independent experiments with similar results; (H and K) Optical microscope showing the Brownian motion and dispersion of OEC-sEVs isolated by supercentrifugation (H) and ExoQuick-TC (K), respectively; (I and L) NTA of OEC-sEVs isolated by supercentrifugation (I) and ExoQuick-TC (L); (J and M) Peak analysis of the distribution of OEC-sEVs isolated by supercentrifugation (J) and ExoQuick-TC (M). Data represent OEC-EVs isolated from n = 4 independent biological preparations, with each sample measured in technical triplicate. Error bars represent the mean ± SD. Variation across preparations reflects biological heterogeneity inherent in EV production. DAPI: 4’,6-diamidino-2-phenylindole; EVs: extracellular vesicles; NTA: nanoparticle tracking analysis; OEC: olfactory ensheathing cell; OEC-sEVs: olfactory ensheathing cell-derived small extracellular vesicles; SD: standard deviation; sEVs: small extracellular vesicles; TEM: transmission electron microscopy; TSG101: tumor susceptibility gene 101.




