

fig4
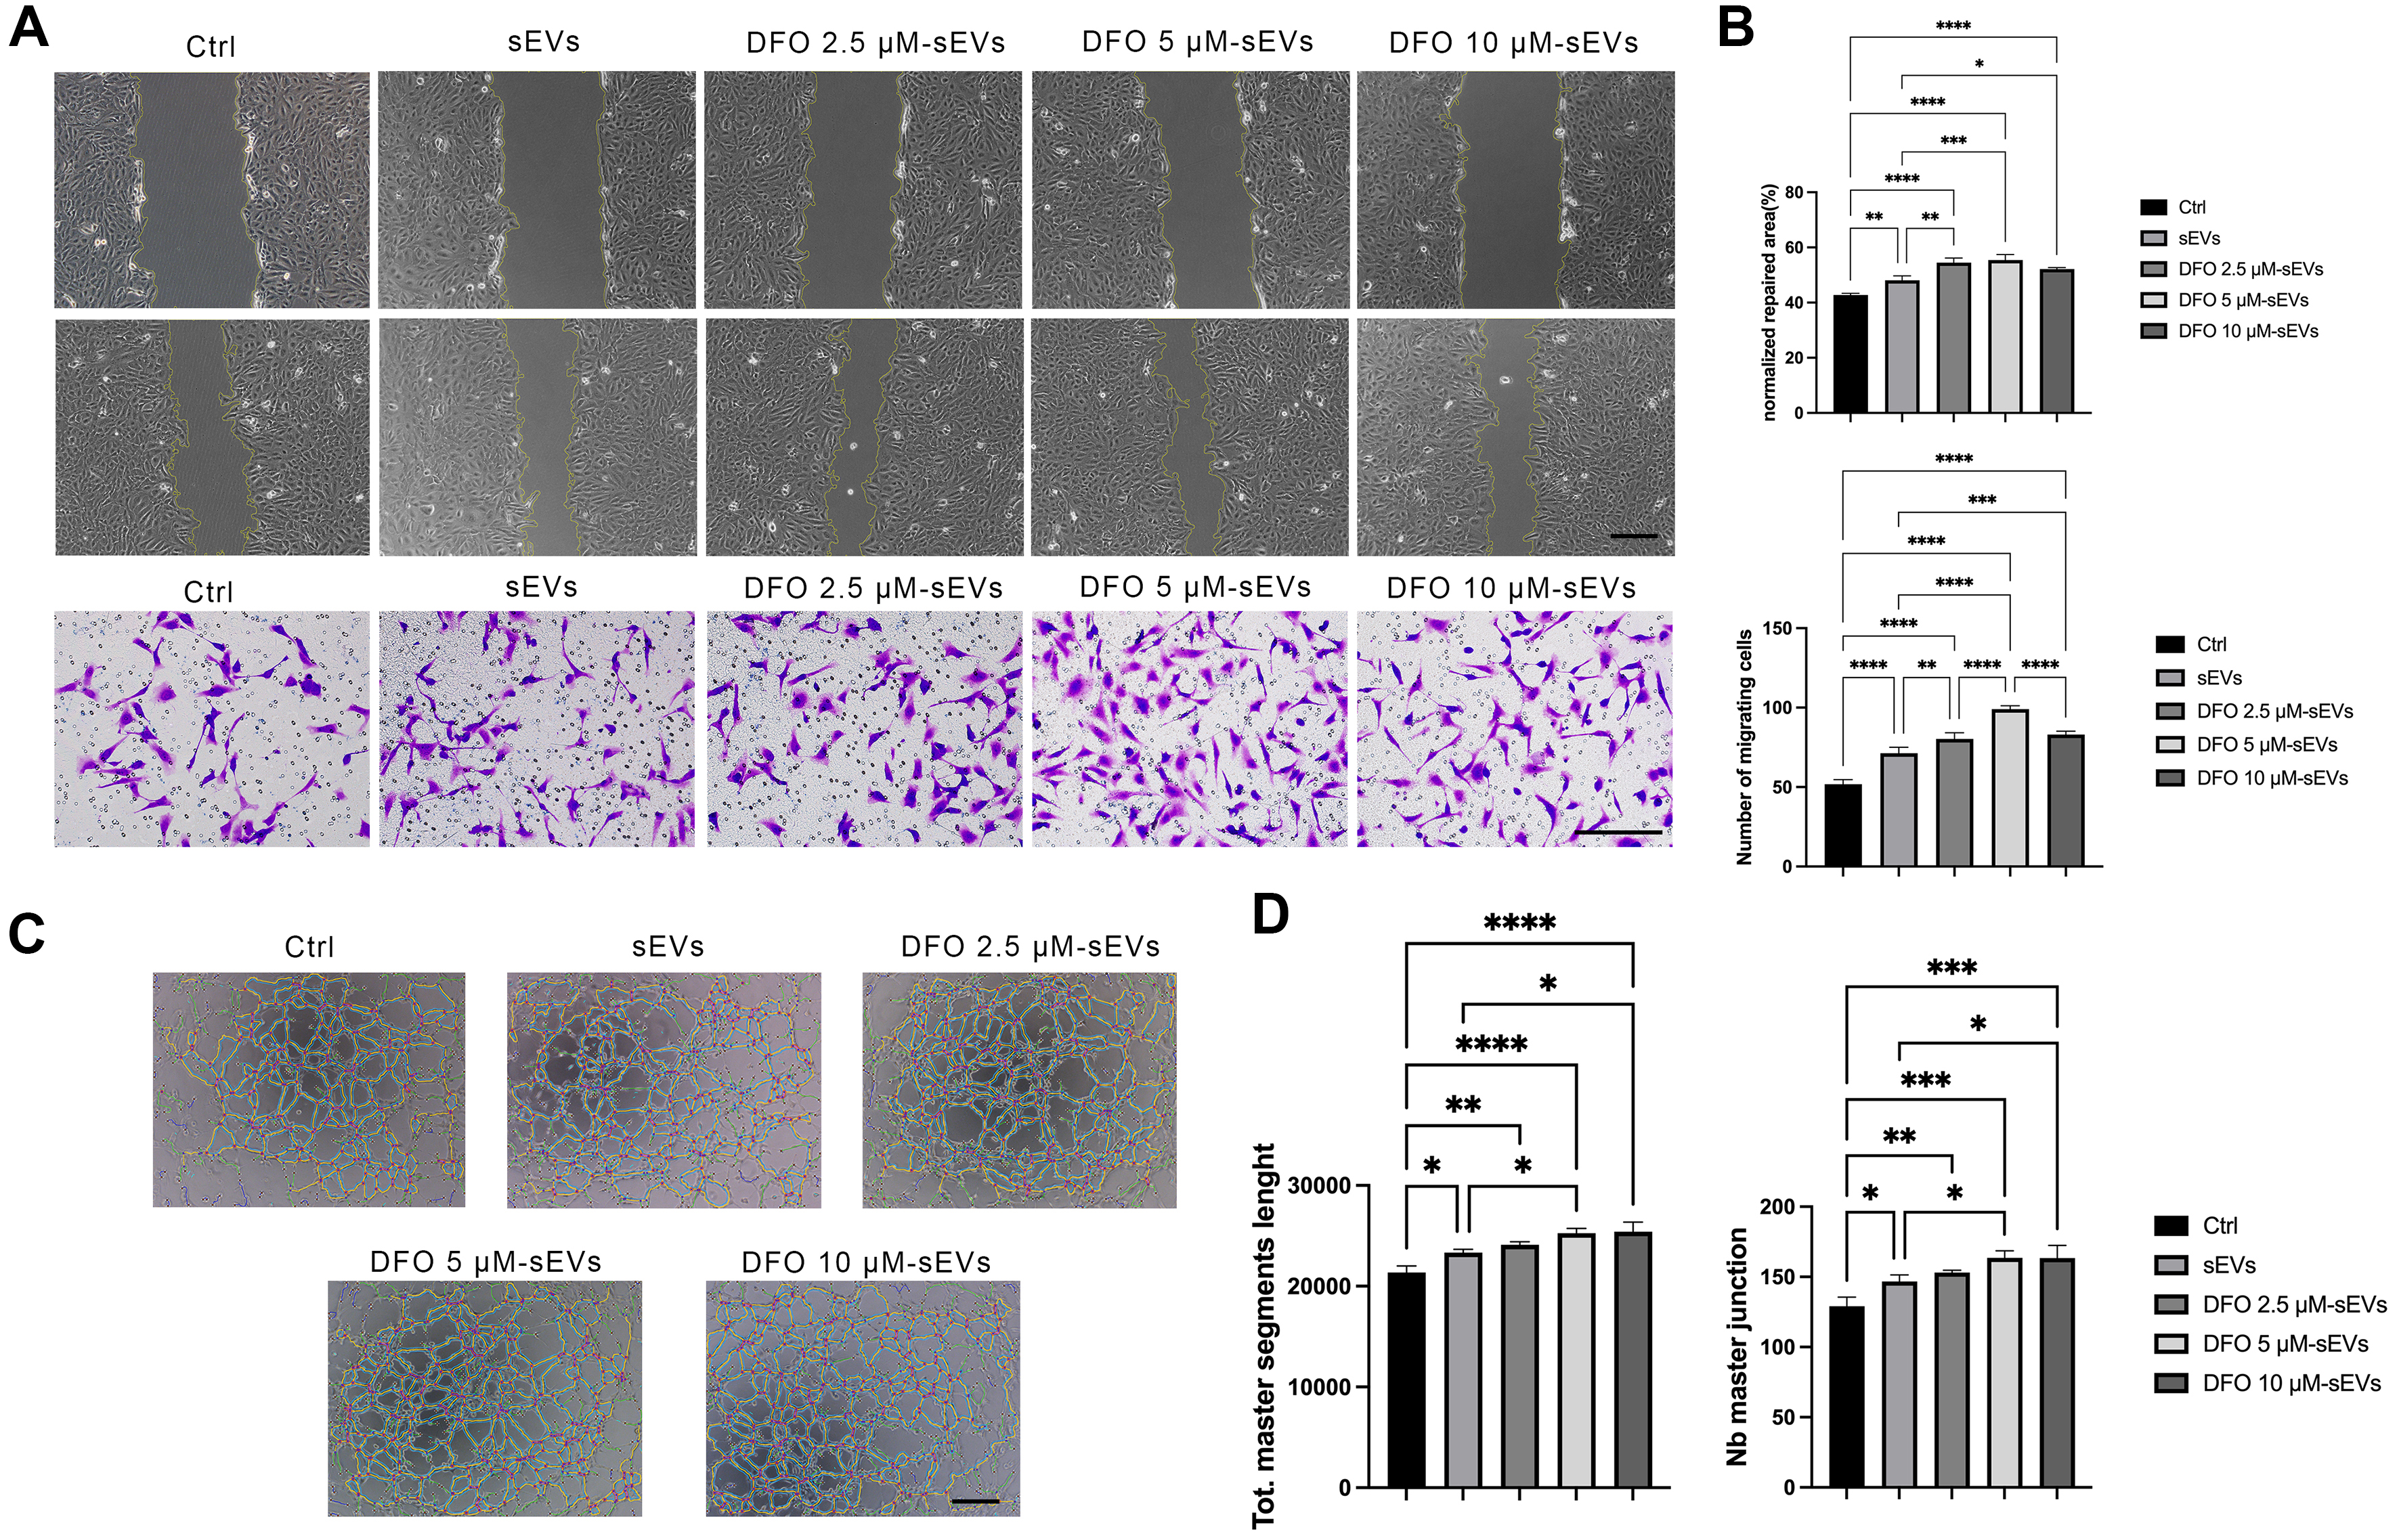
Figure 4. Effects of DFO-sEVs on HUVECs migration and angiogenesis. (A) HUVEC migration assessed using wound-healing and Transwell assays; Scale bar = 200 μm, with (B) quantification of migration; (C) HUVEC tube formation in vitro; Scale bar = 200 μm; (D) quantification of total master segment length and number of master junctions. Values are expressed as mean ± SD. Data were analyzed by one-way ANOVA with Tukey’s HSD post hoc comparisons; at least three independent biological replicates were included. *P < 0.05; **P < 0.01; ***P < 0.001; ****P < 0.0001. ANOVA: Analysis of variance; Ctrl: control; DFO: deferoxamine; HSD: honestly significant difference; HUVECs: human umbilical vein endothelial cells; Nb: number; SD: standard deviation; sEVs: small extracellular vesicles; Tot.: total.




