

fig3
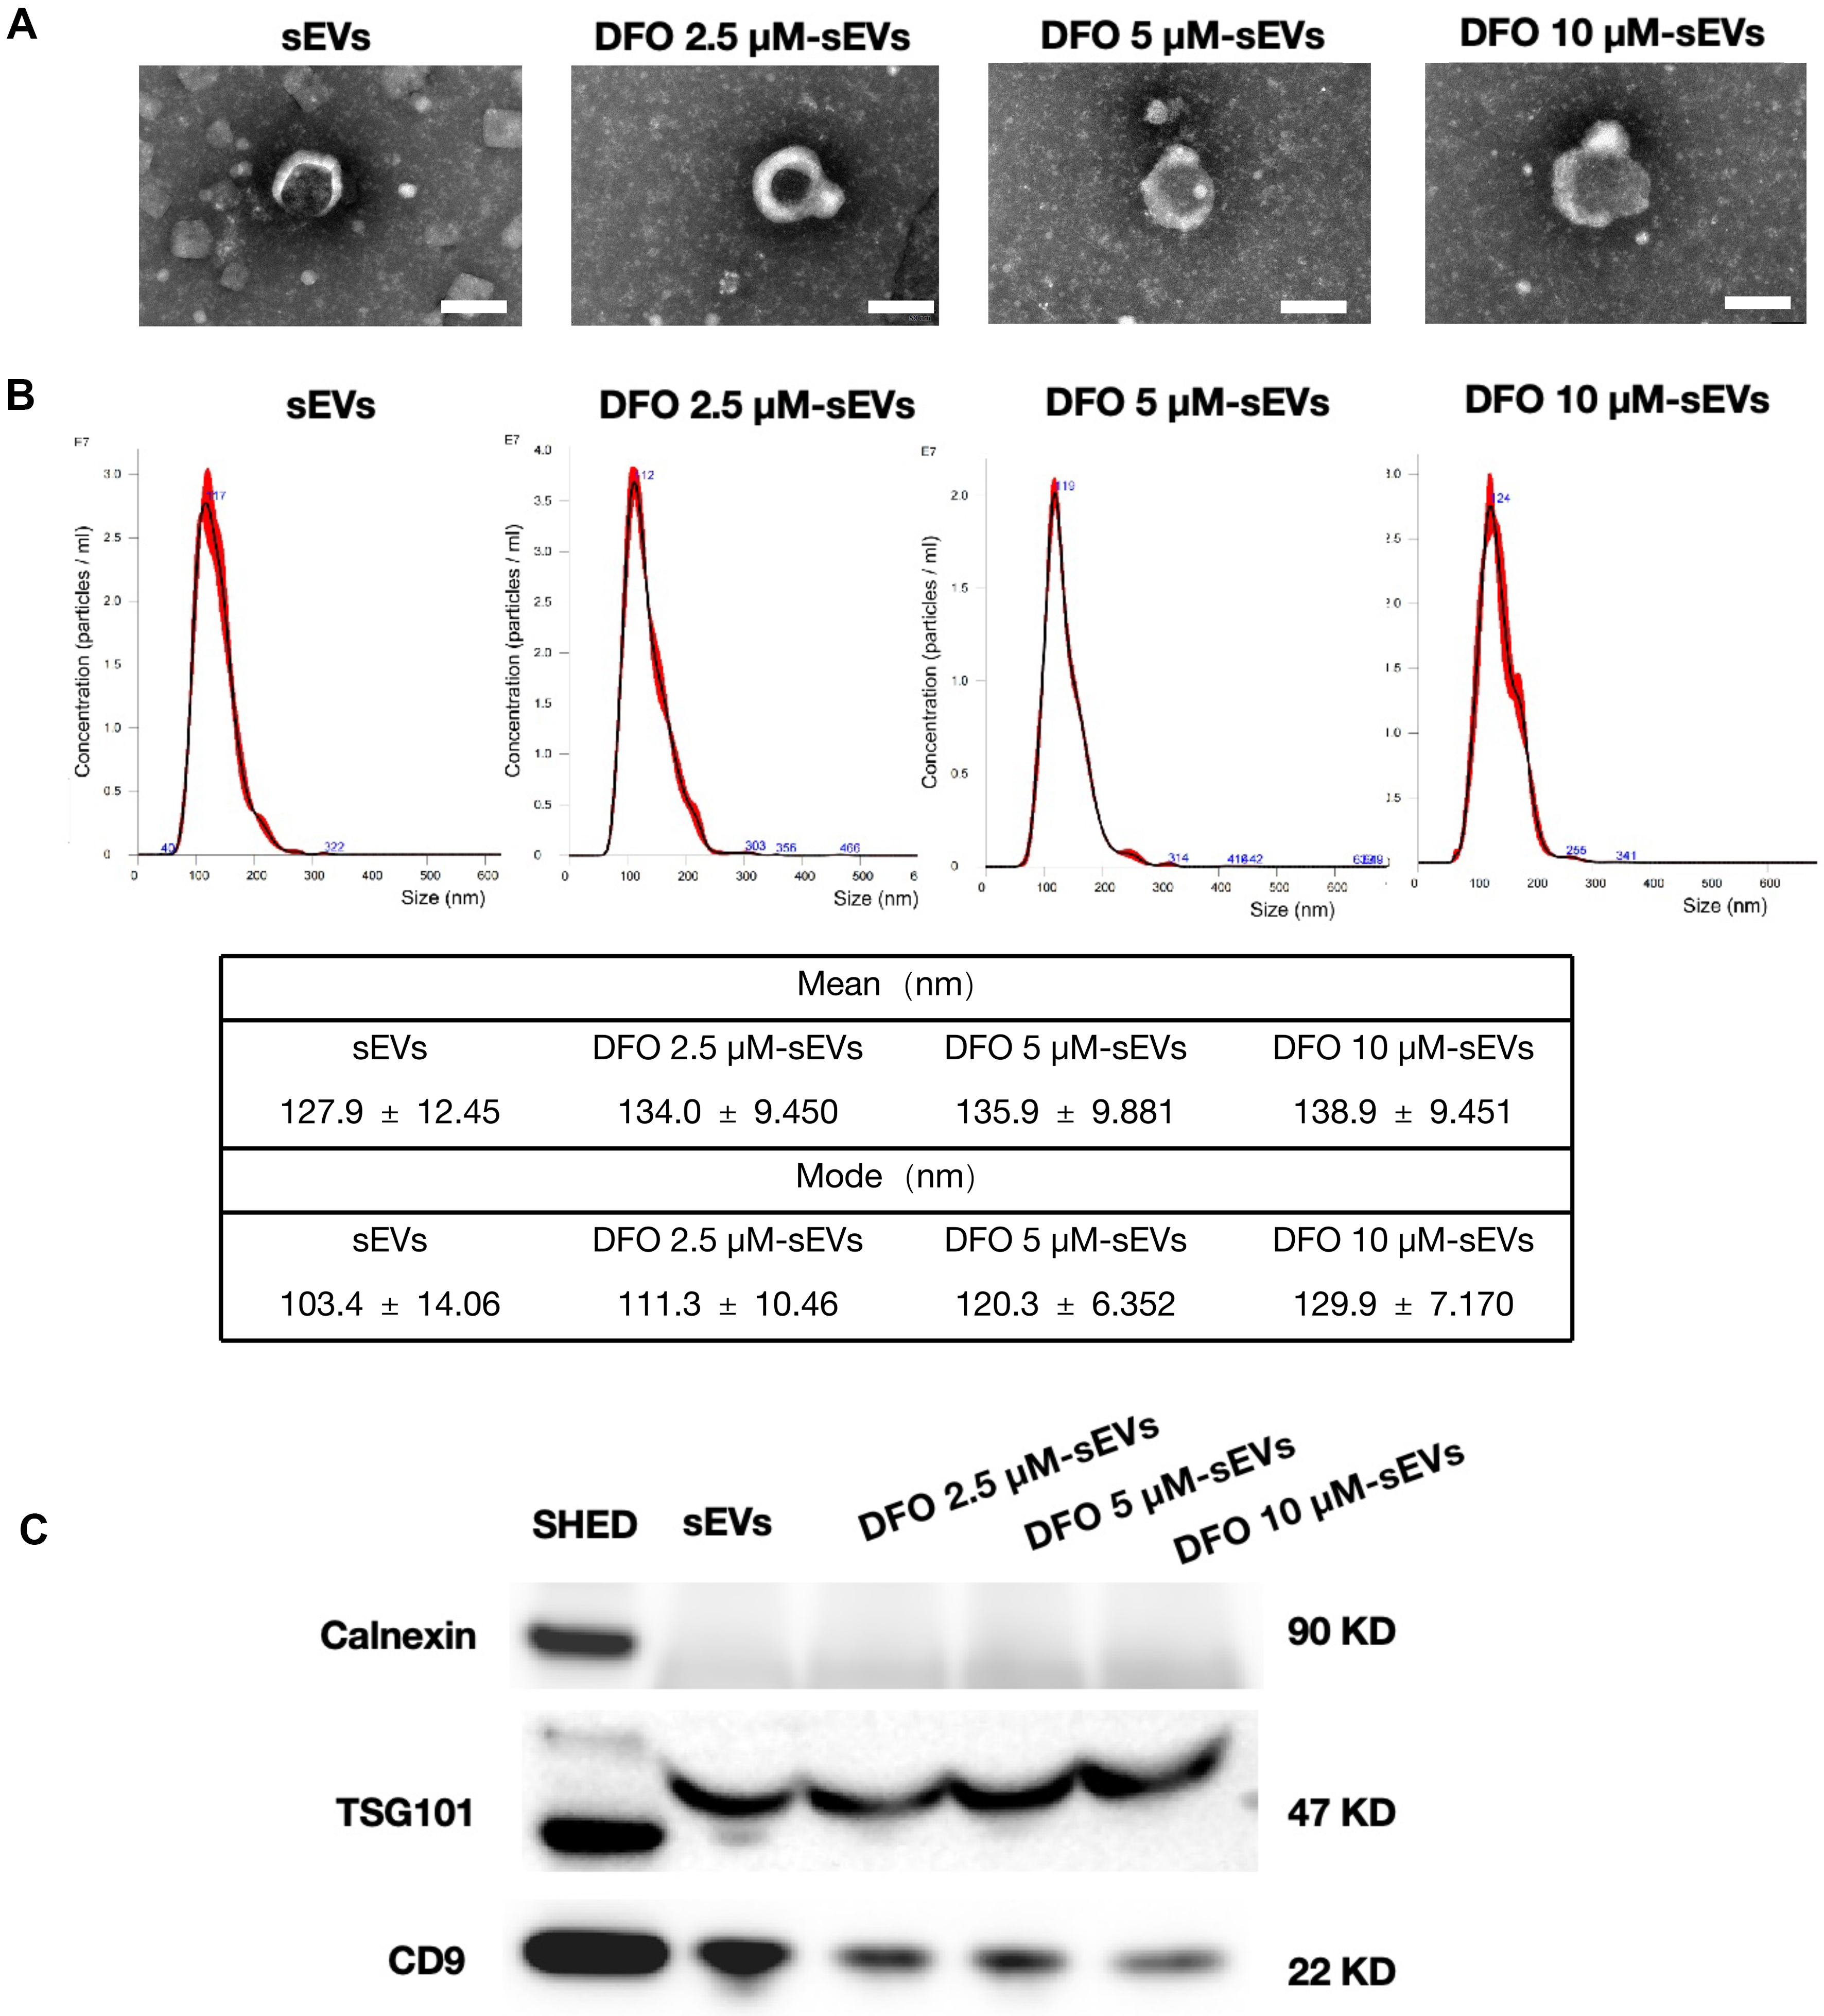
Figure 3. Characterization of SHED-derived sEVs. (A) sEV morphology observed by TEM; Scale bar = 100 nm; (B) size distribution of sEVs determined by NTA. Representative size distribution profiles are shown. The mean and mode particle sizes were calculated from three independent sEV preparations and are expressed as the mean ± SD (n = 3); (C) Western blot analysis of sEV-associated markers. For Western blot analysis, three technical replicates were performed for each biological replicate. All experiments included three independent biological replicates. Representative images are shown. CD9: Cluster of differentiation 9; DFO: deferoxamine; KD: kilodalton; NTA: nanoparticle tracking analysis; sEVs: small extracellular vesicles; SD: standard deviation; SHED: stem cells from human exfoliated deciduous teeth; TEM: transmission electron microscopy; TSG101: tumor susceptibility gene 101.




