

fig2
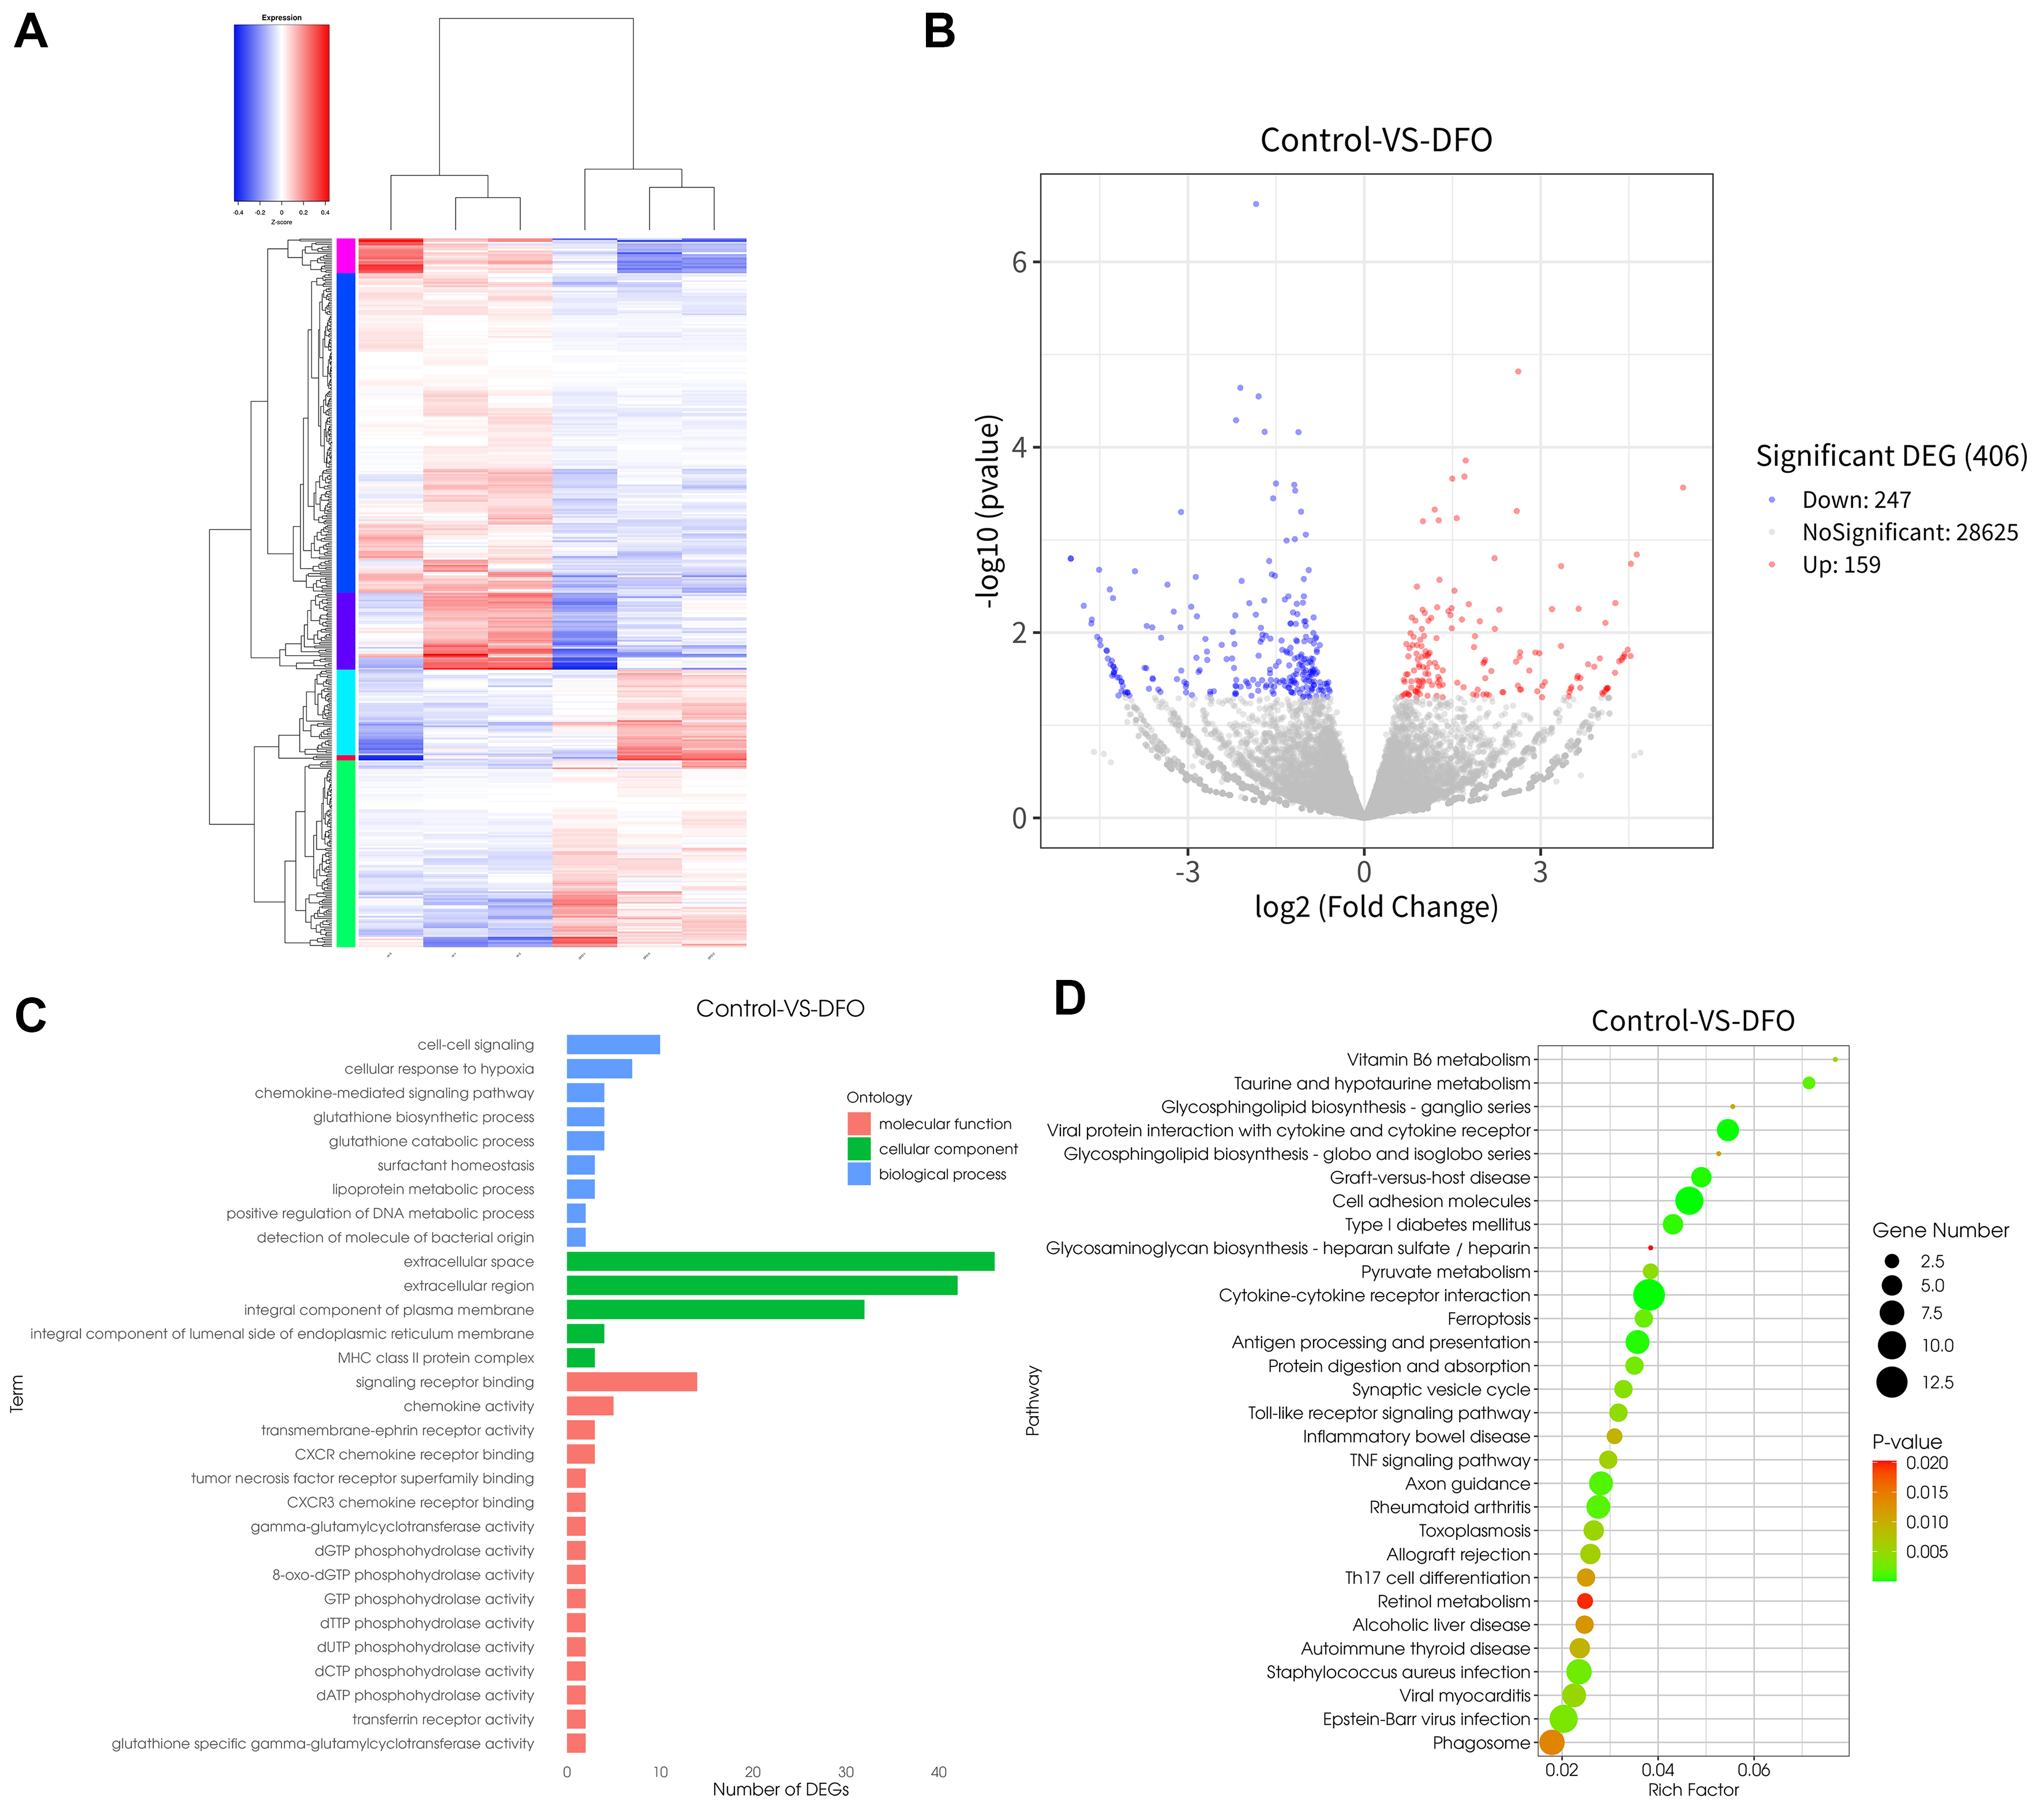
Figure 2. Transcriptomic Profiling Analysis. (A) Heatmap of clustering analysis; (B) volcano plot illustrating DEGs; (C) bar chart showing GO enrichment results; (D) KEGG enrichment results presented as a bubble plot. For RNA-seq, each group comprised three independent biological replicates (n = 3). Each replicate represents an RNA sample independently extracted from separately cultured SHED samples. ANOVA: Analysis of variance; CXCR: C-X-C chemokine receptor; CXCR3: C-X-C chemokine receptor 3; DEG: differentially expressed gene; DEGs: differentially expressed genes; DFC: deferoxamine-free control; DFO: deferoxamine; dATP: deoxyadenosine triphosphate; dCTP: deoxycytidine triphosphate; dGTP: deoxyguanosine triphosphate; dTTP: deoxythymidine triphosphate; dUTP: deoxyuridine triphosphate; GTP: guanosine triphosphate; GO: Gene Ontology; KEGG: Kyoto Encyclopedia of Genes and Genomes; MHC: major histocompatibility complex; RNA-seq: RNA sequencing; SHED: stem cells from human exfoliated deciduous teeth; TNF: tumor necrosis factor.




