

fig1
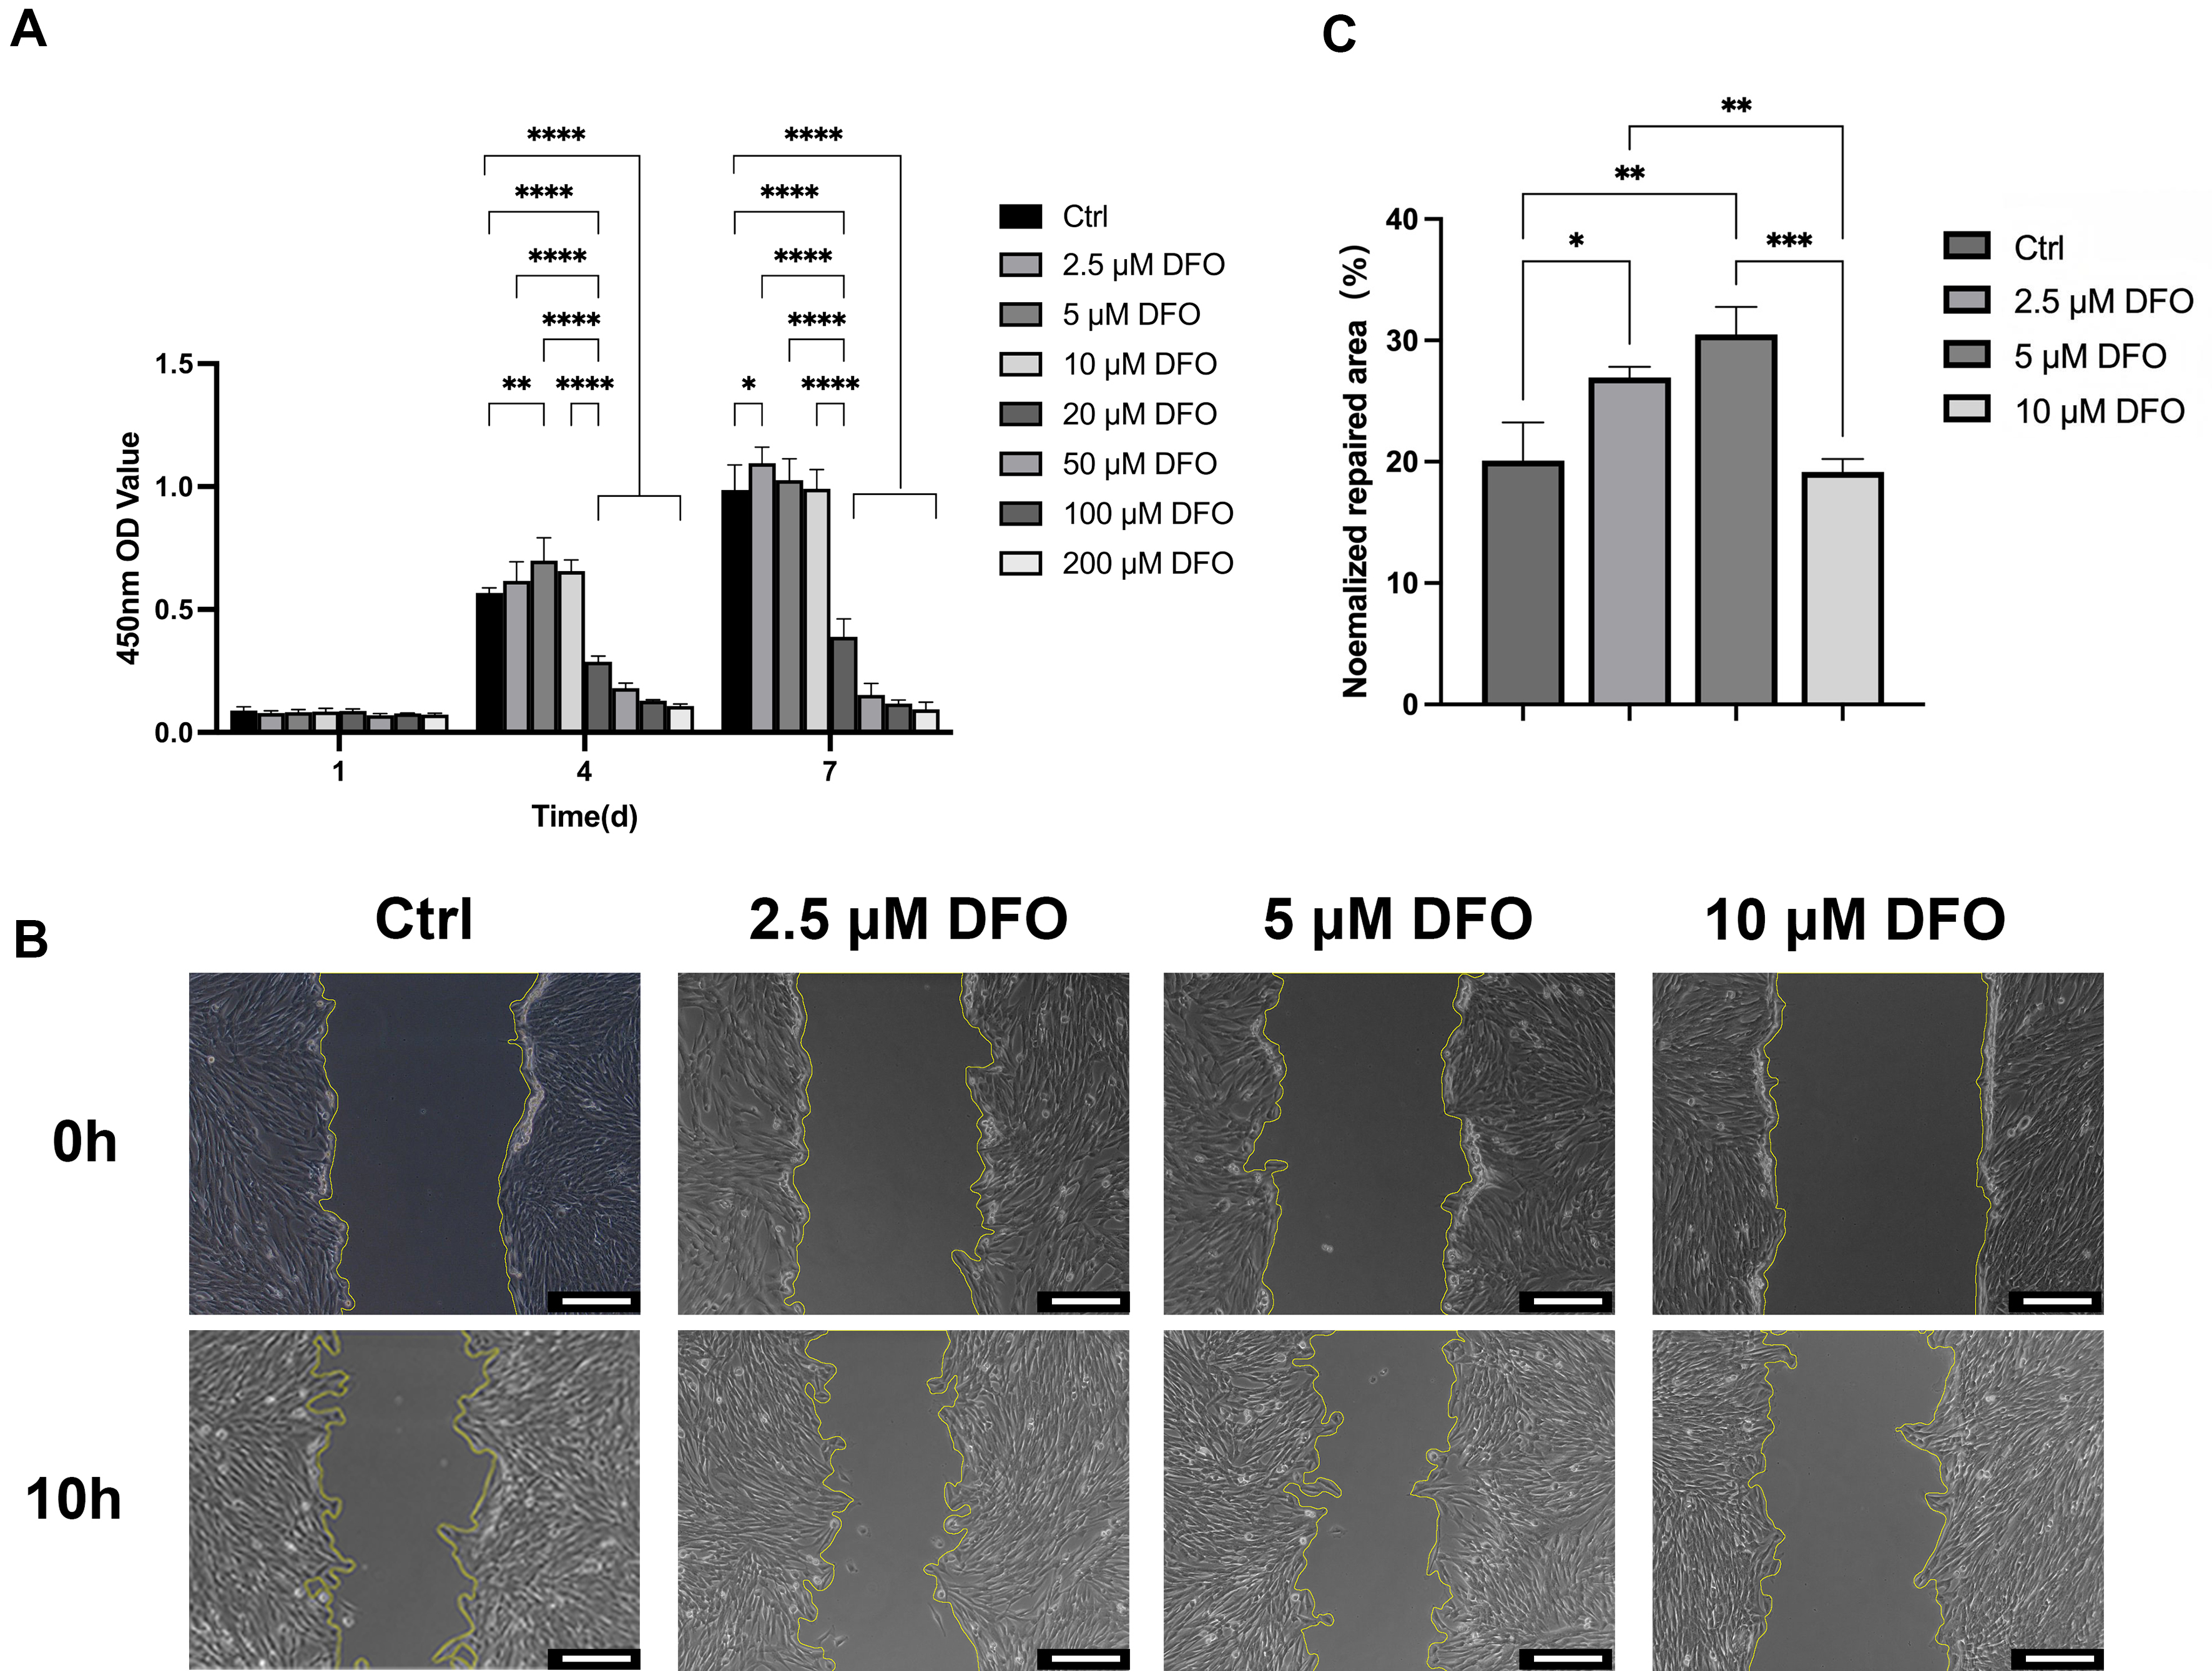
Figure 1. Responses of SHED to DFO Preconditioning. (A) Assessment of cell activity on days 1, 4, and 7. Data were analyzed by two-way ANOVA with Tukey’s multiple-comparisons test; four independent biological replicates were included (n = 4); (B) SHED migration; Scale bar = 200 μm; (C) quantification of the migration results. Data were analyzed by one-way ANOVA with Tukey’s HSD post hoc comparisons; three independent biological replicates were included (n = 3). *P < 0.05; **P < 0.01; ***P < 0.001; ****P < 0.0001. ANOVA: Analysis of variance; Ctrl: control; DFO: deferoxamine; HSD: honestly significant difference; OD: optical density; SHED: stem cells from human exfoliated deciduous teeth.




