

fig6
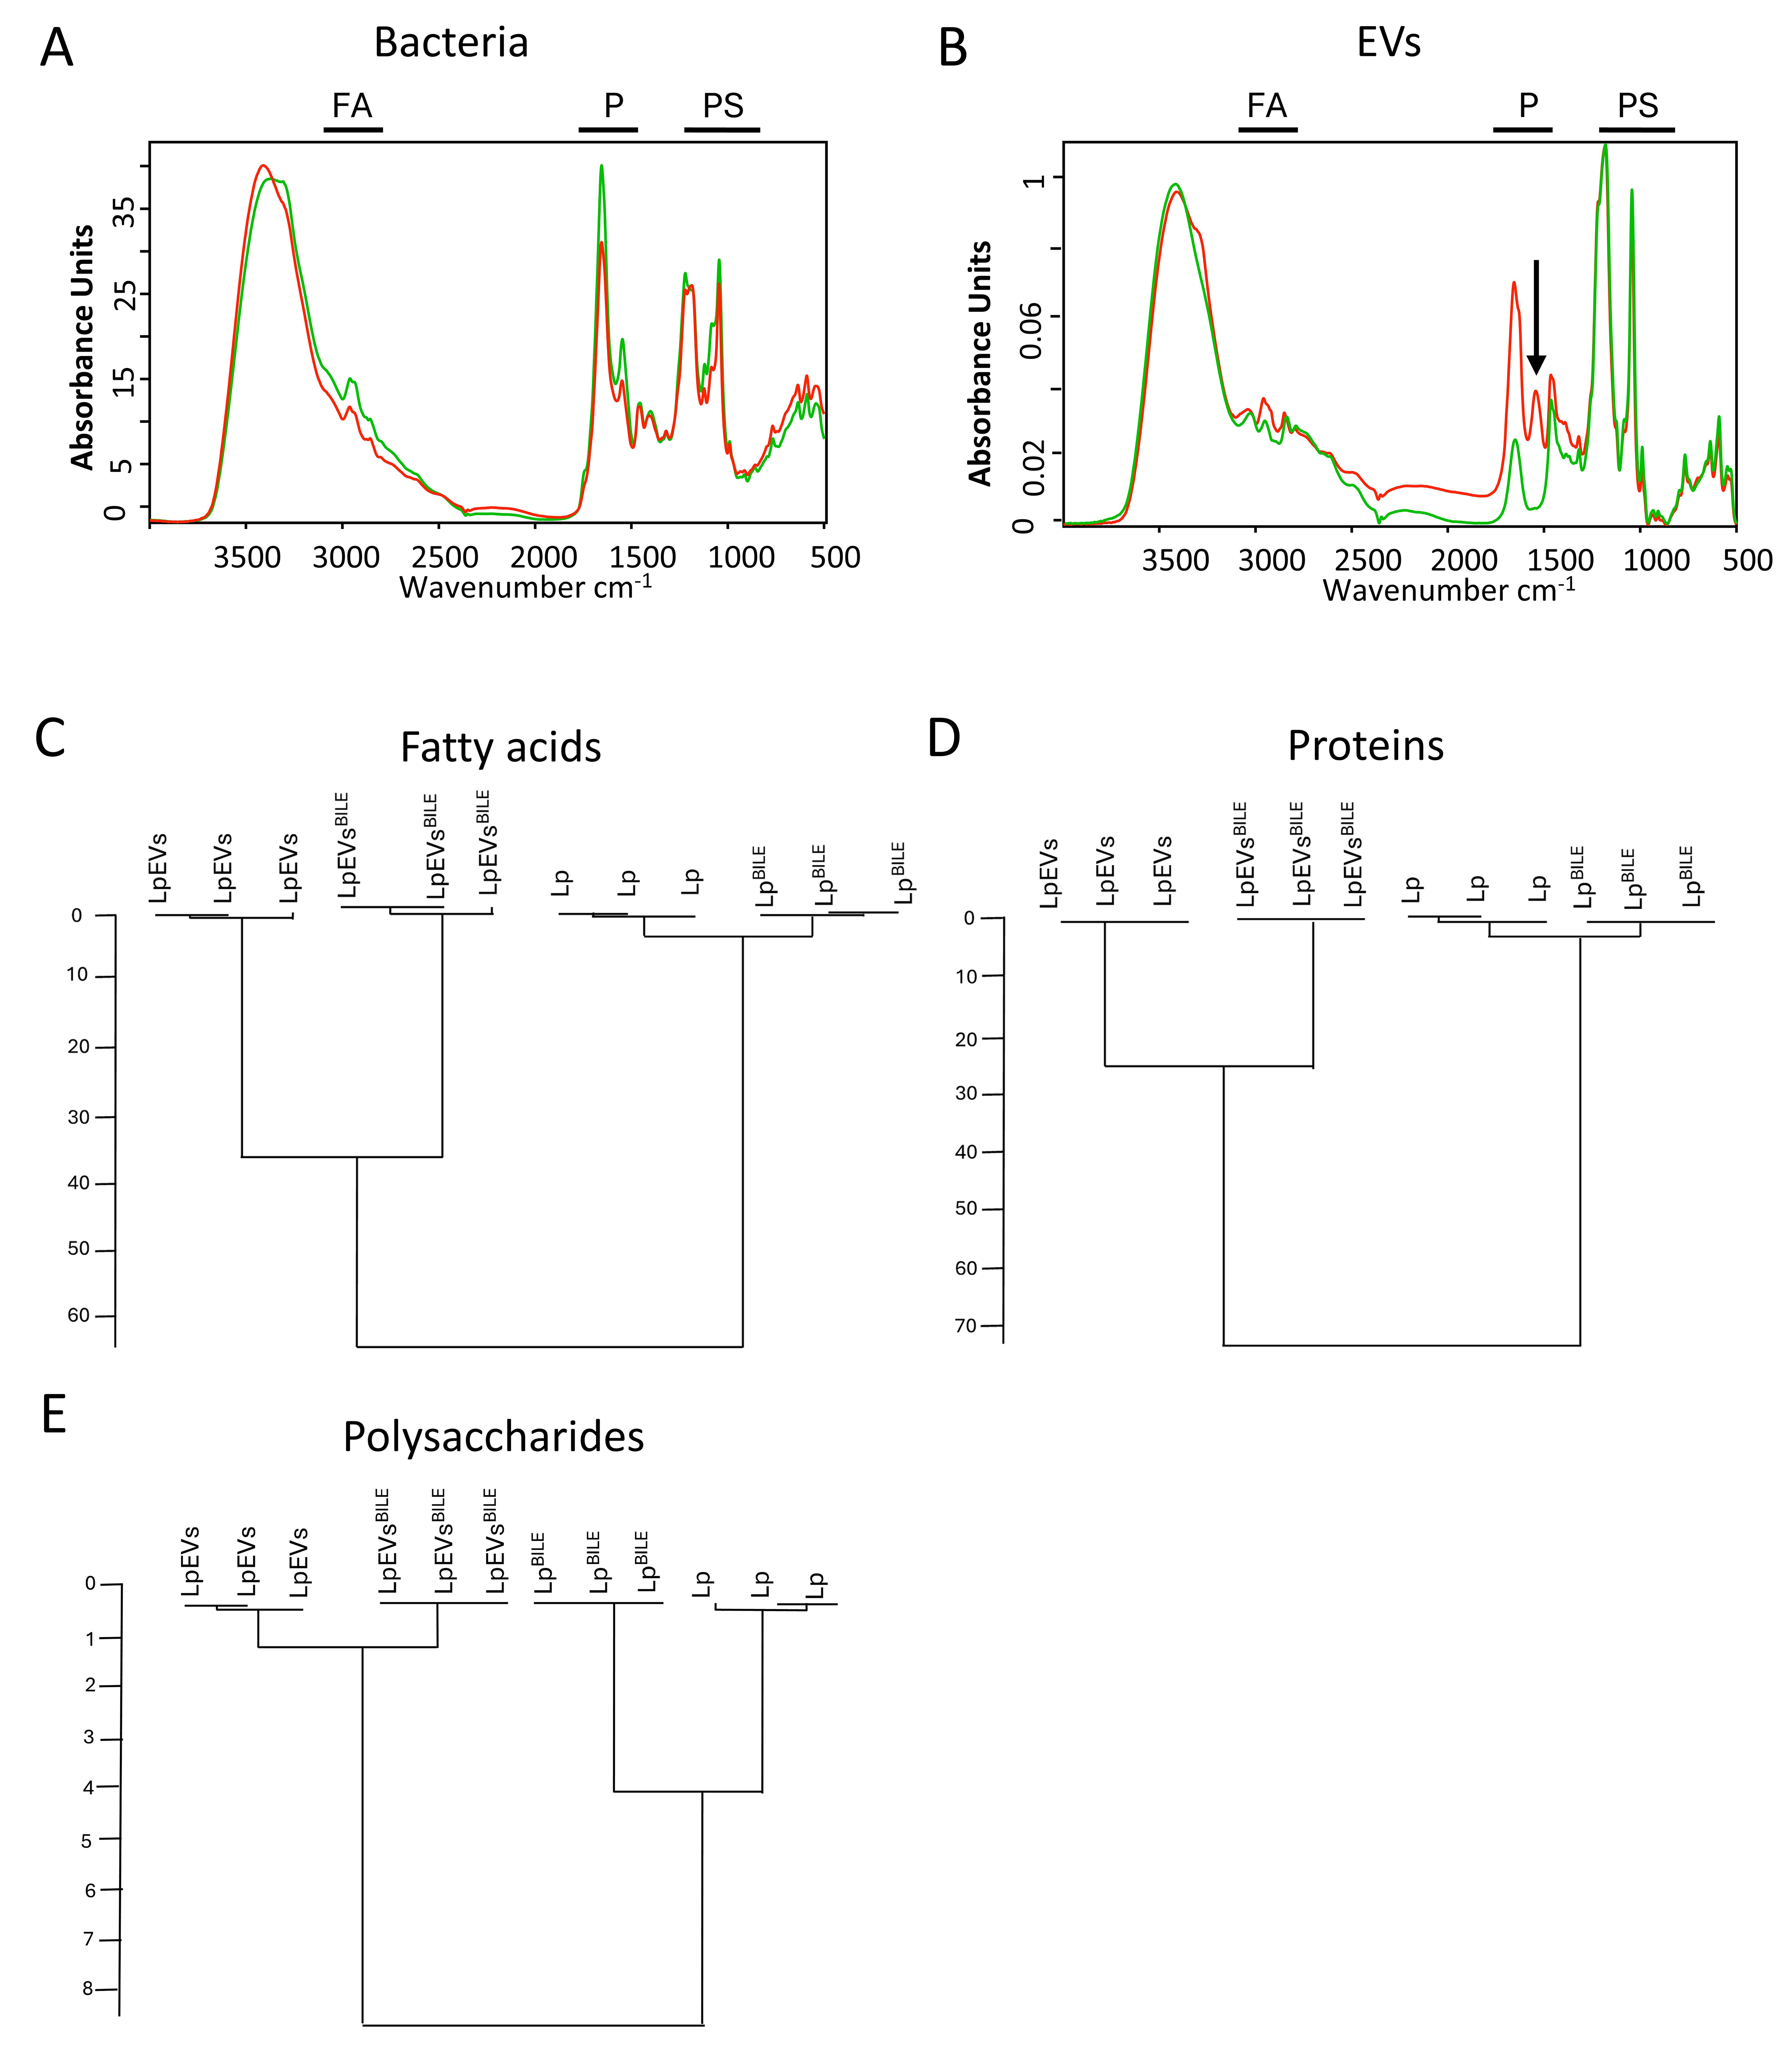
Figure 6. Metabolic fingerprints of L. plantarum, L. plantarumBILE, LpEVs, and LpEVsBILE obtained via FTIR spectroscopy. FTIR spectral profiles of L. plantarum, L. plantarumBILE, LpEVs, and LpEVsBILE were recorded and analyzed. Representative spectra for the parent bacteria (A) and EVs (B) are shown, with specific regions indicated: FA, fatty acids; P, proteins; PS, polysaccharides. HCA was performed on preprocessed and vector-normalized spectra using the Ward algorithm at repro level 30, based on spectral regions corresponding to fatty acids (C), proteins (D), and polysaccharides (E). Data represent three biological replicates; each measured in triplicate (technical replicates). L. plantarum: Lactiplantibacillus plantarum; LpEVs: L. plantarum EVs; FTIR: Fourier-transform infrared spectroscopy; EVs: extracellular vesicles; HCA: hierarchical cluster analysis.




