

fig5
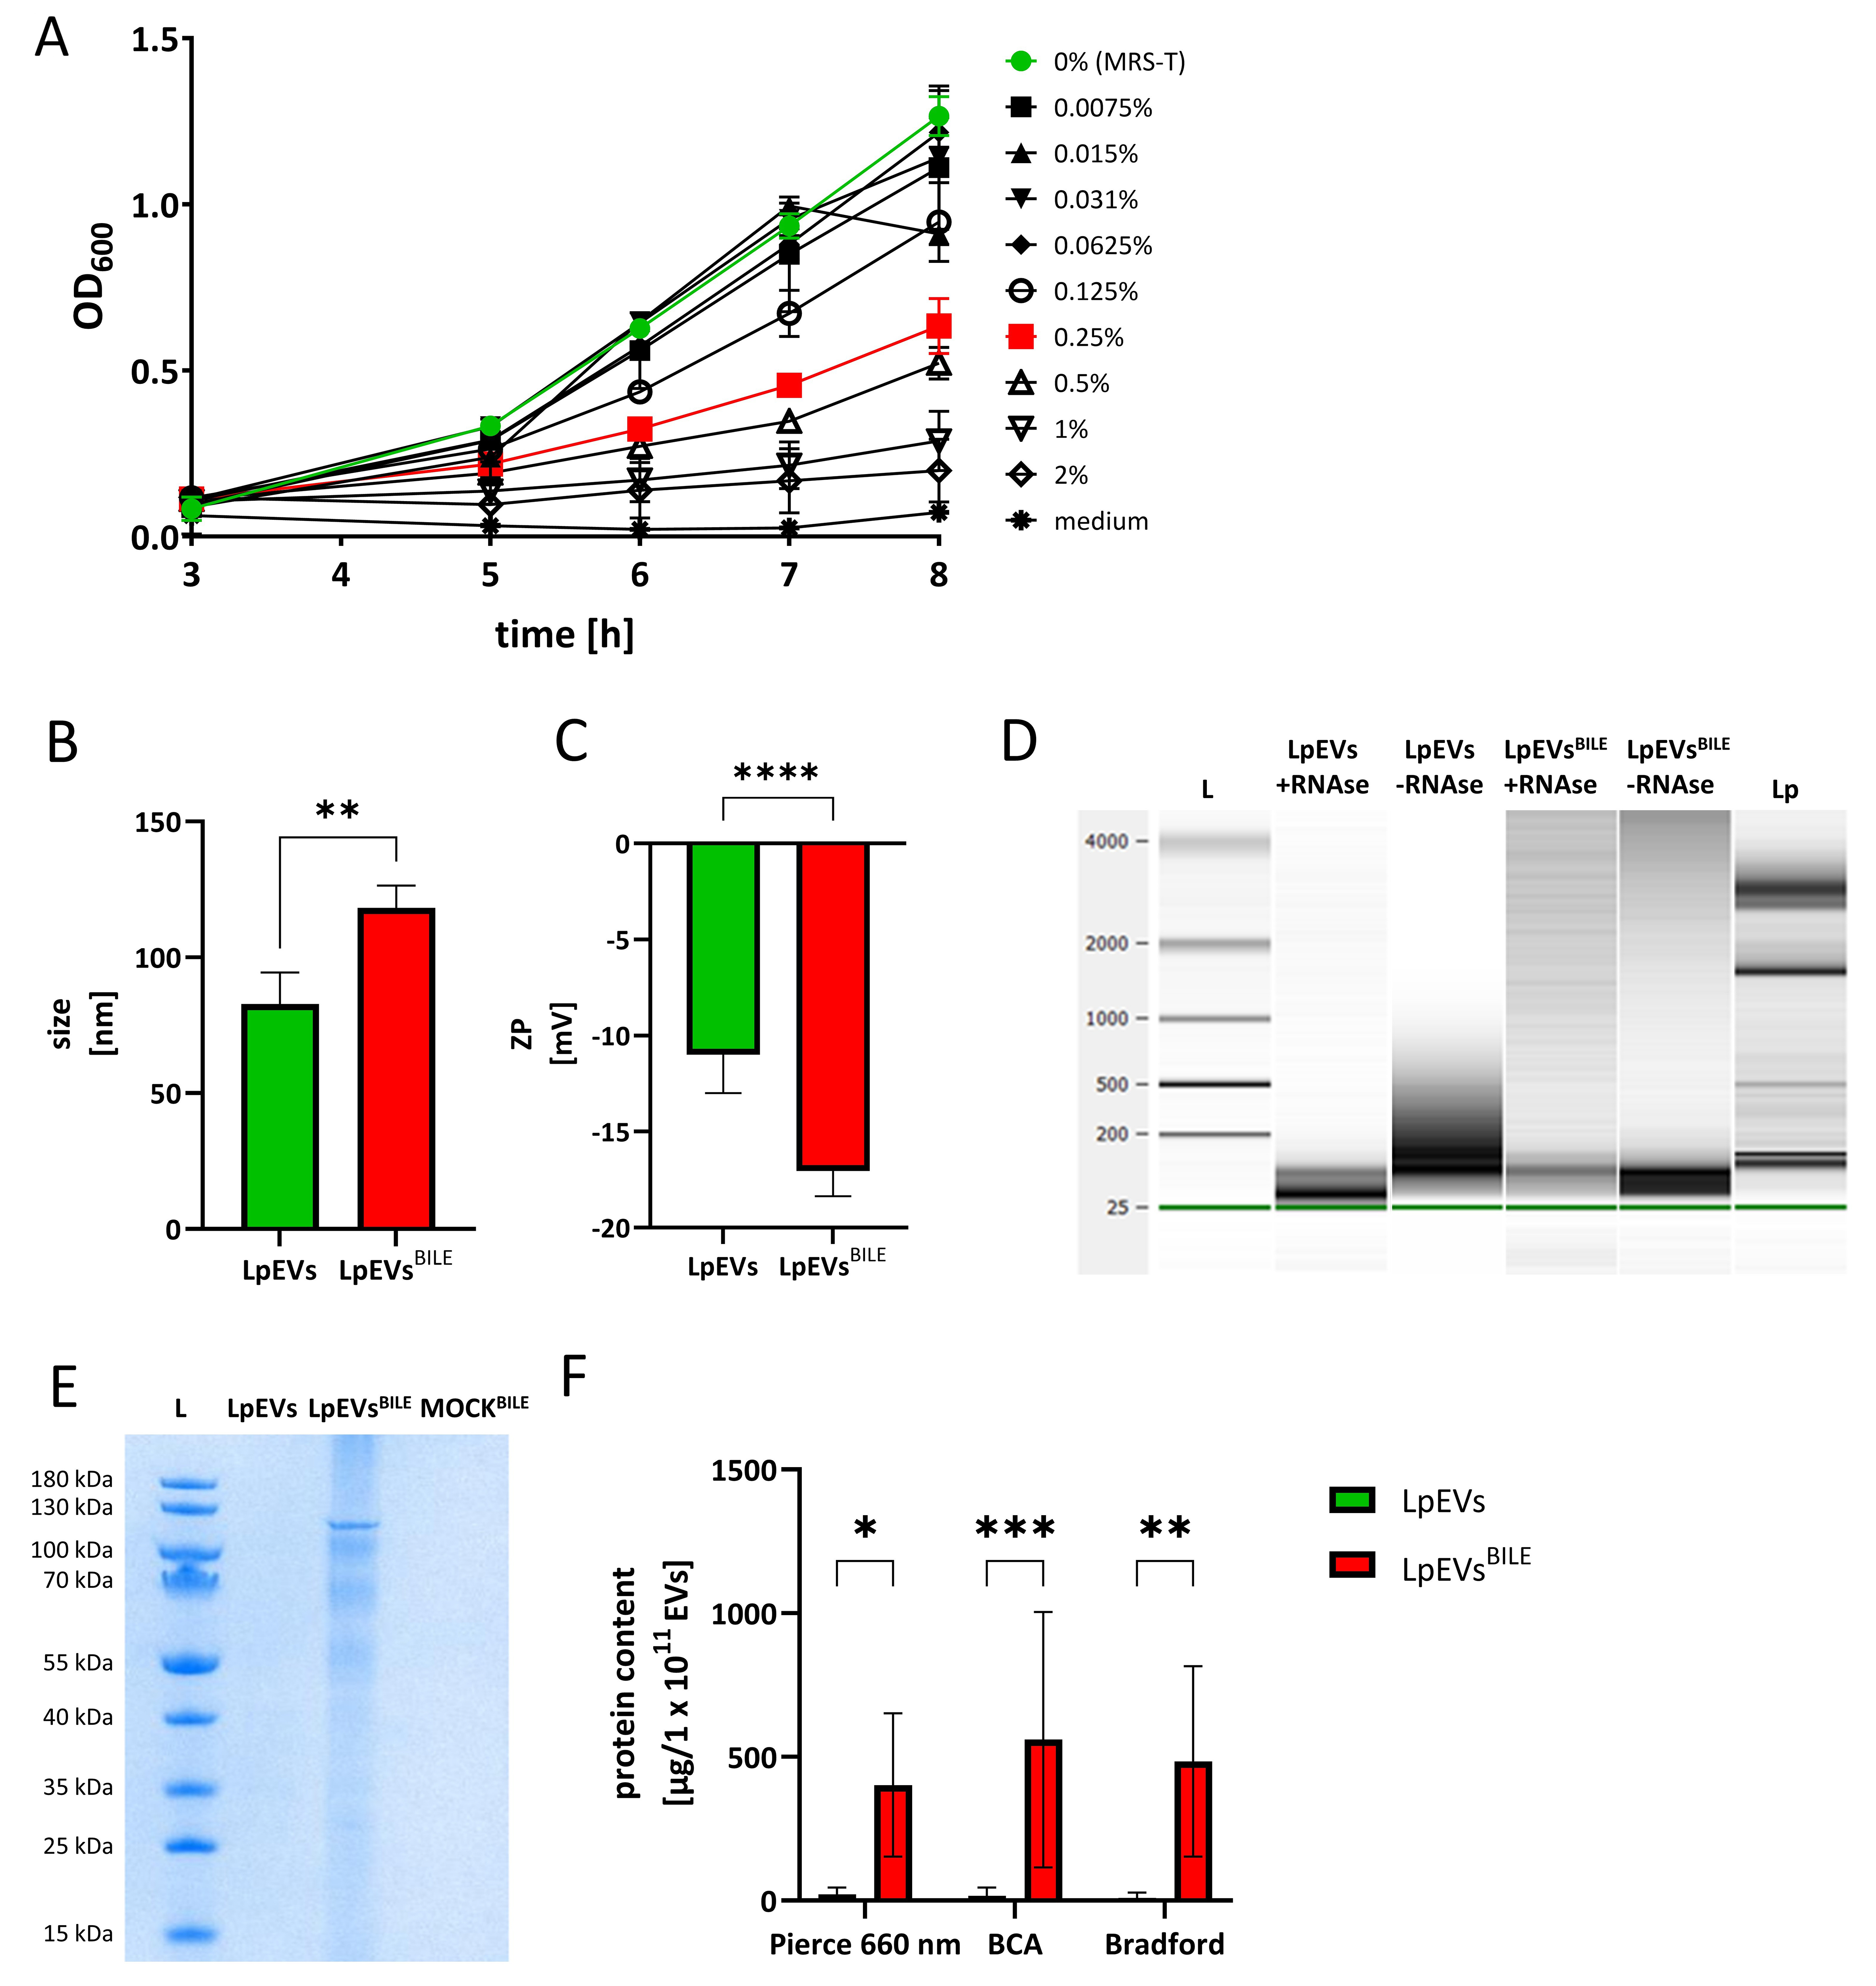
Figure 5. Influence of bile on the growth of L. plantarum and the characteristics of its EVs. (A) Growth curves of L. plantarum cultured in MRS-T supplemented with increasing concentrations of bovine bile (0%-2%). Three biological replicates; (B) Size distribution and (C) ZP measurements of LpEVs and LpEVsBILE obtained using a Zetasizer. Three independent batches analyzed (biological replicates); (D) RNA content in untreated and RNase-treated EVs analyzed using a Bioanalyzer. L, RNA ladder; (E) SDS–PAGE of 1.5 × 10¹⁰ LpEVs and 0.7 × 10¹⁰ LpEVsBILE, was loaded per lane., and 20 µL of MOCK-EVsBILE. L, protein ladder; (F) Total protein content of LpEVs and LpEVsBILE quantified using the Pierce 660 nm Protein Assay, BCA, and Bradford assays. Results are normalized to µg of protein per 1 × 10¹¹ EVs and expressed as mean ± SD, data obtained from measurements of three independent EV batches (biological replicates). (B and C) were analyzed using unpaired two-tailed t-tests; (F) was analyzed using two-way ANOVA. Significance levels are indicated as *P ≤ 0.05, **P < 0.01, ***P < 0.001, and ****P < 0.0001. L. plantarum: Lactiplantibacillus plantarum; EVs: extracellular vesicles; MRS-T: De Man–Rogosa–Sharpe broth supplemented with Tween 80; ZP: zeta potential; LpEVs: L. plantarum EVs; SDS–PAGE: sodium dodecyl sulfate polyacrylamide gel electrophoresis; MOCK-EVs: EVs produced from medium without inoculation with bacteria; BCA: bicinchoninic acid; SD: standard deviation; ANOVA: analysis of variance.




