

fig1
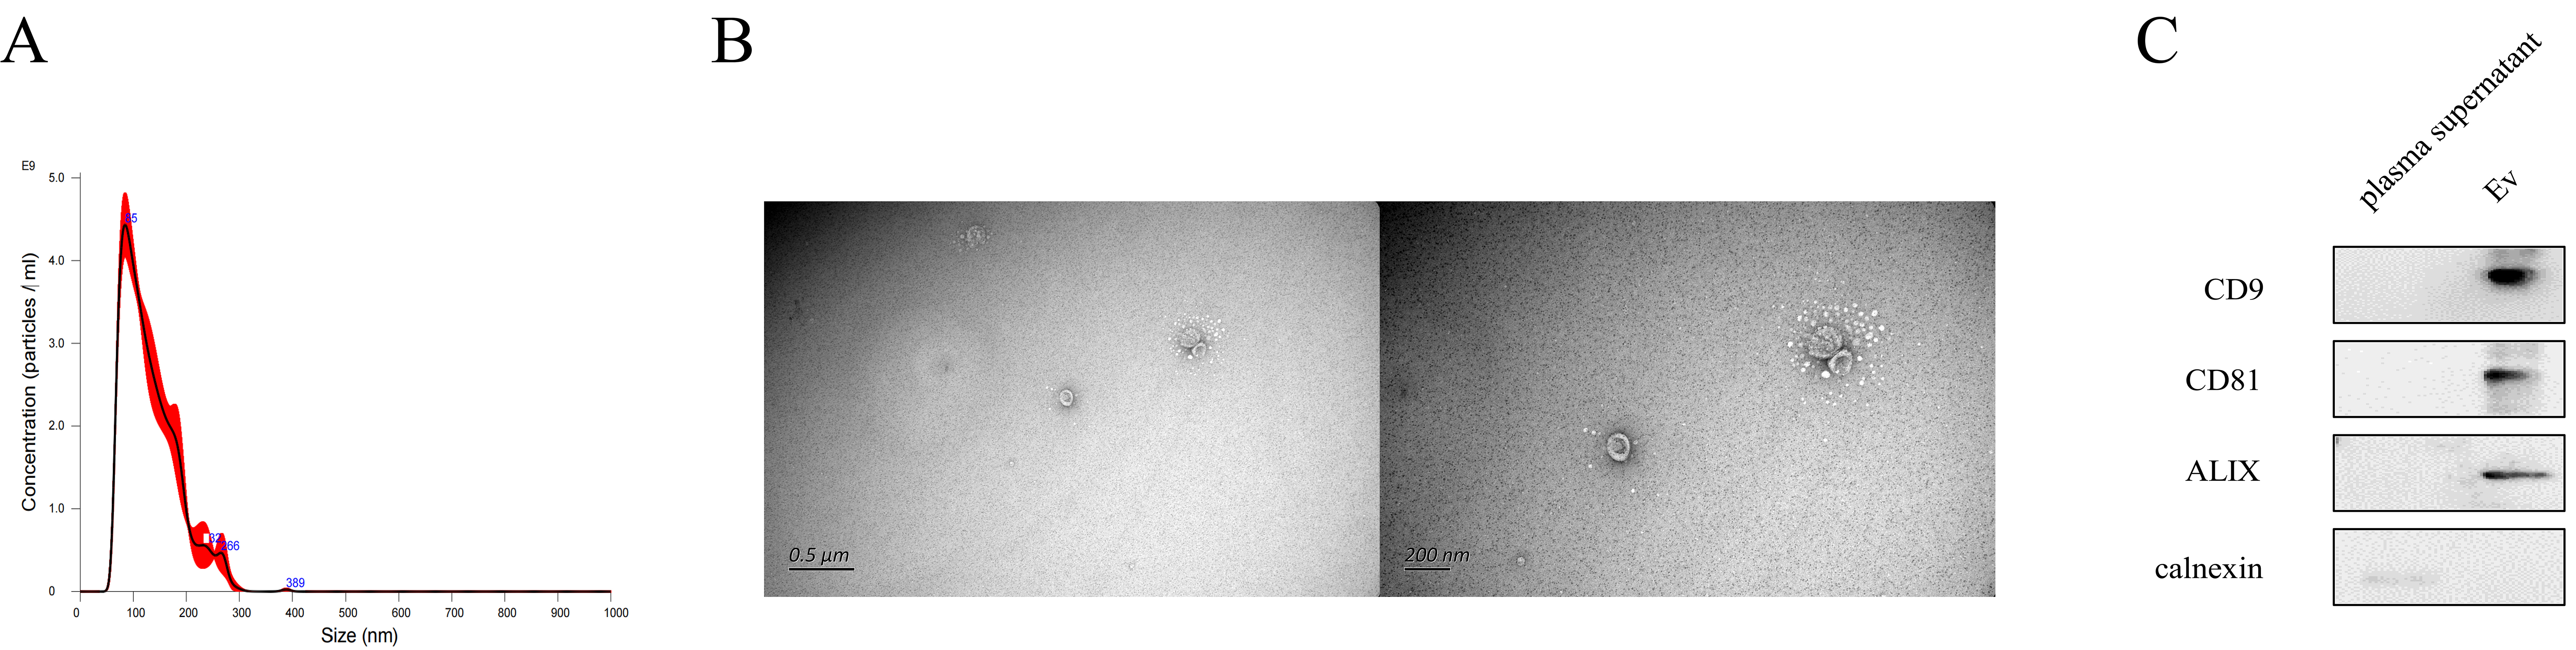
Figure 1. Identification of EV from the mixed sample of healthy controls, being independent of the PBA samples and without biological duplicates. (A) Particle size distribution analysis of EVs by NTA; (B) Representative TEM images showing membrane-bound vesicular structures with round to cup-shaped morphology. Scale bars, 0.5 μm and 200 nm; (C) Western blot analysis of EV-associated proteins CD9, CD81, ALIX, and alnexin. EV: Extracellular vesicle; NTA: nanoparticle tracking analysis; TEM: Transmission Electron Microscopy.




