

fig3
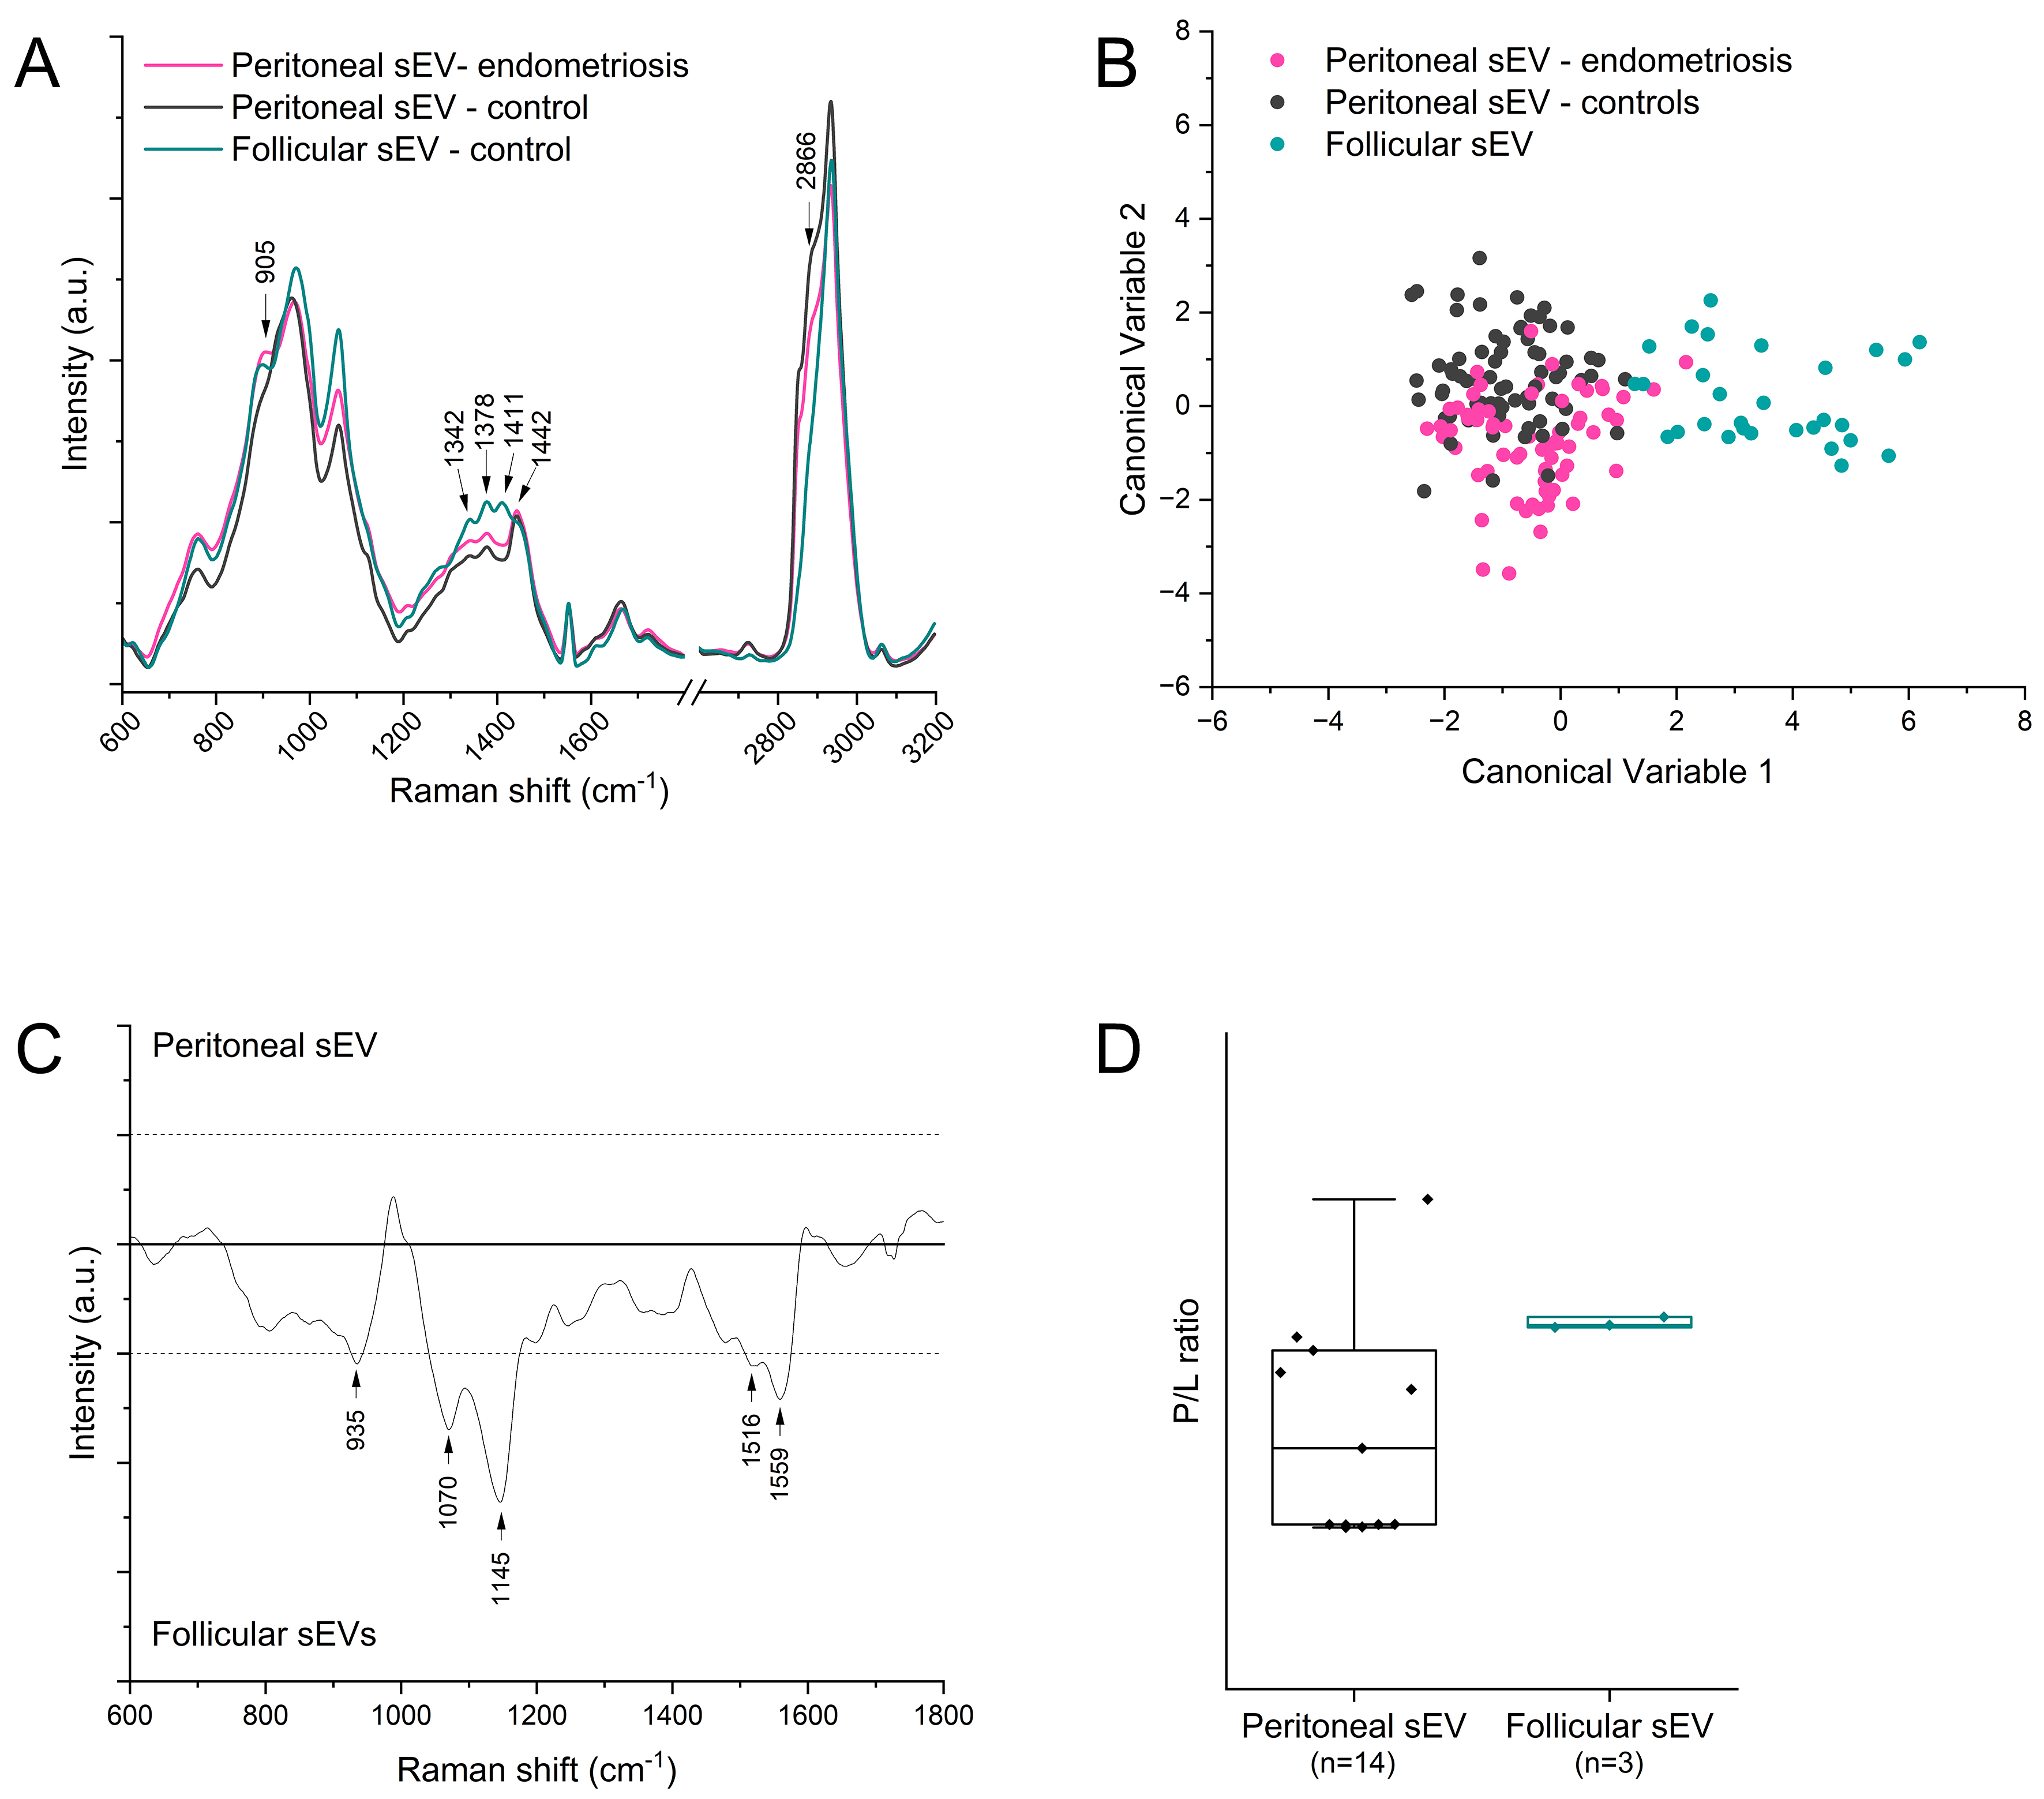
Figure 3. (A) Average Raman spectra obtained from samples of sEVs isolated from the peritoneal fluid of controls (grey line), peritoneal fluid of women with a diagnosis of endometriosis (magenta line), and follicular fluid (green line). Arrows highlight those peaks that change most between the considered groups; (B) Scatter plot of the canonical variable scores obtained after the PCA-LDA analysis of the considered samples. Each dot represents one single spectrum of sEVs; (C) Subtraction spectrum obtained by the subtraction of the average Raman spectrum of follicular sEVs from the Raman spectrum of peritoneal sEVs. Peaks that significantly differ between the two samples (intensity > 0.05) are highlighted with black arrows; and (D) Spectral P/L ratio calculated on the average spectra of sEVs. Each dot represents one single patient. P/L: Protein-to-lipid; PCA-LDA: principal component analysis-linear discriminant analysis; sEVs: small extracellular vesicles.




