

fig1
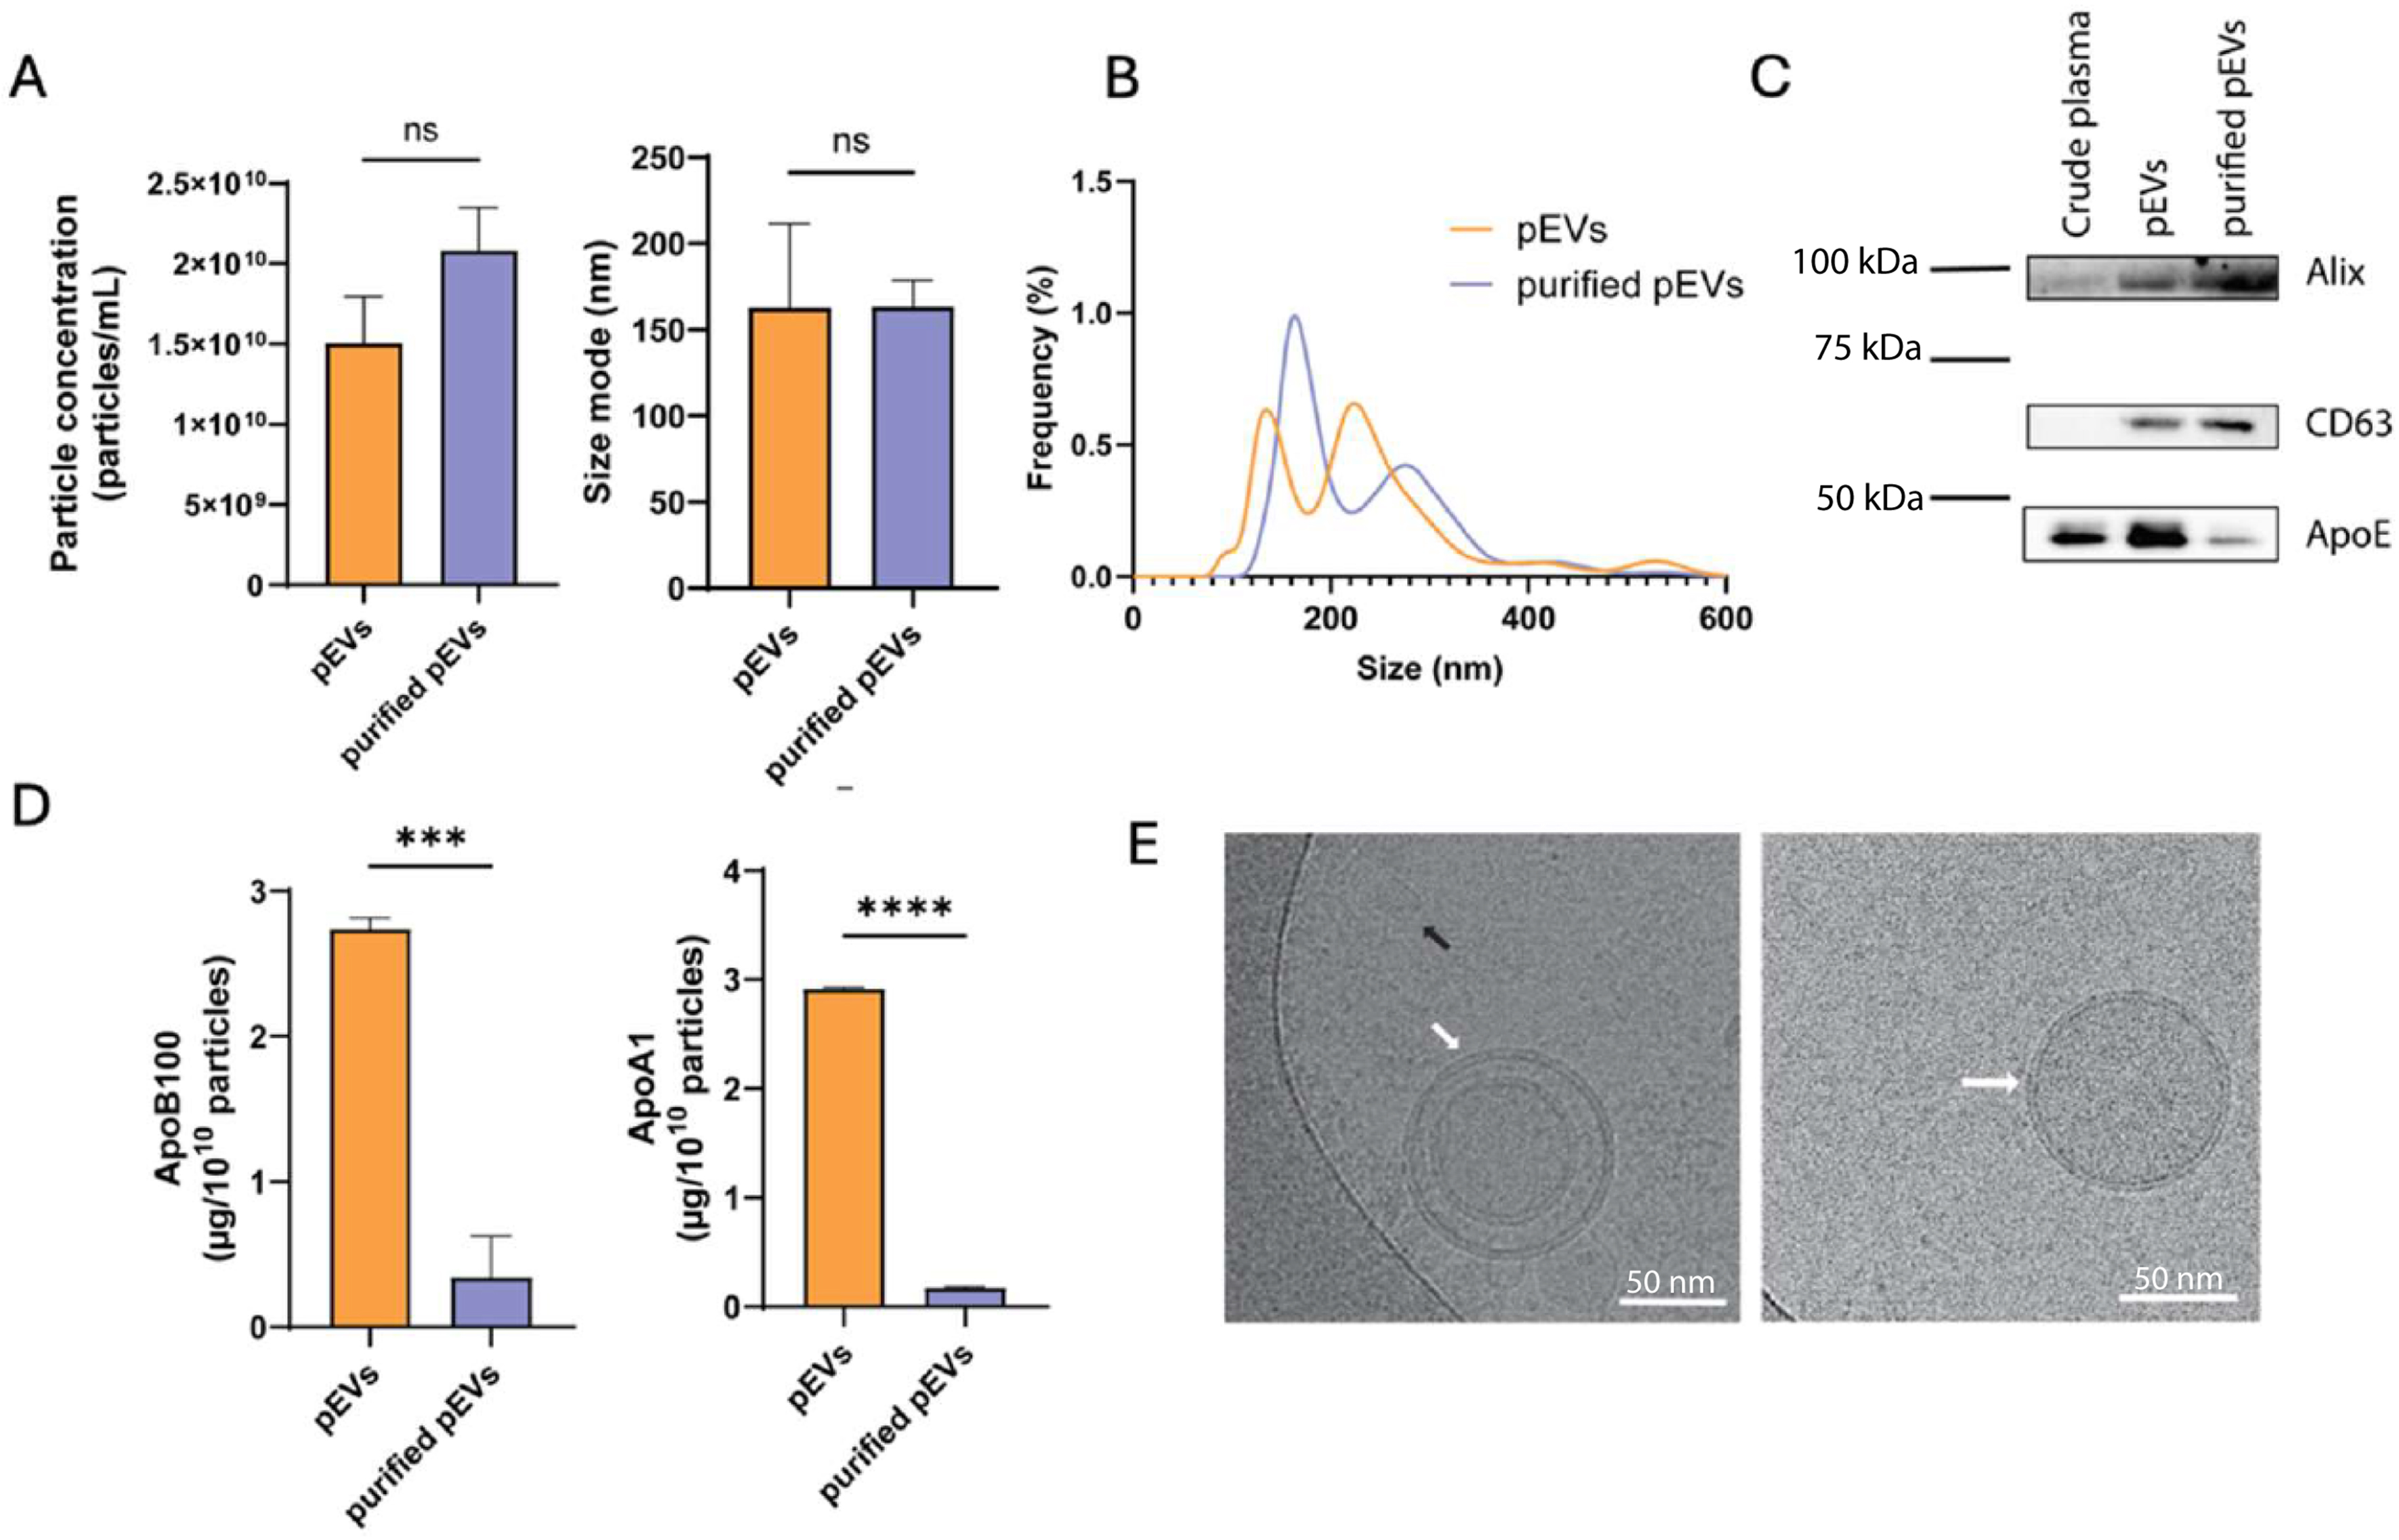
Figure 1. EVs were characterised using NTA to determine (A) particle concentration and size mode, and (B) size distribution. (C) Western blot of EV markers (Alix and CD63) and ApoE as a lipoprotein-associated protein alongside (D) levels of ApoB-100 and ApoA-I evaluated by ELISA. (E) Cryo-TEM images of individual EVs (white arrow) and lipoprotein components (black arrow). Data are presented as mean ± SD. Data in (A) represent technical replicates from a single plasma donor, whereas all other experimental data (B-E) were obtained from three independent biological replicates (n = 3). The corresponding original, uncropped Western blot images are presented in Supplementary Figure 3. Statistical significance is indicated as ns; ***P < 0.001; ****P < 0.0001. Alix: ALG-2-interacting protein X; ApoA-I: apolipoprotein A-I; ApoB-100: apolipoprotein B-100; ApoE: apolipoprotein E; CD63: cluster of differentiation 63; cryo-TEM: cryogenic transmission electron microscopy; ELISA: enzyme-linked immunosorbent assay; EVs: extracellular vesicles; ns: non-significant; NTA: nanoparticle tracking analysis; pEVs: plasma-derived extracellular vesicles; SD: standard deviation.