
fig7
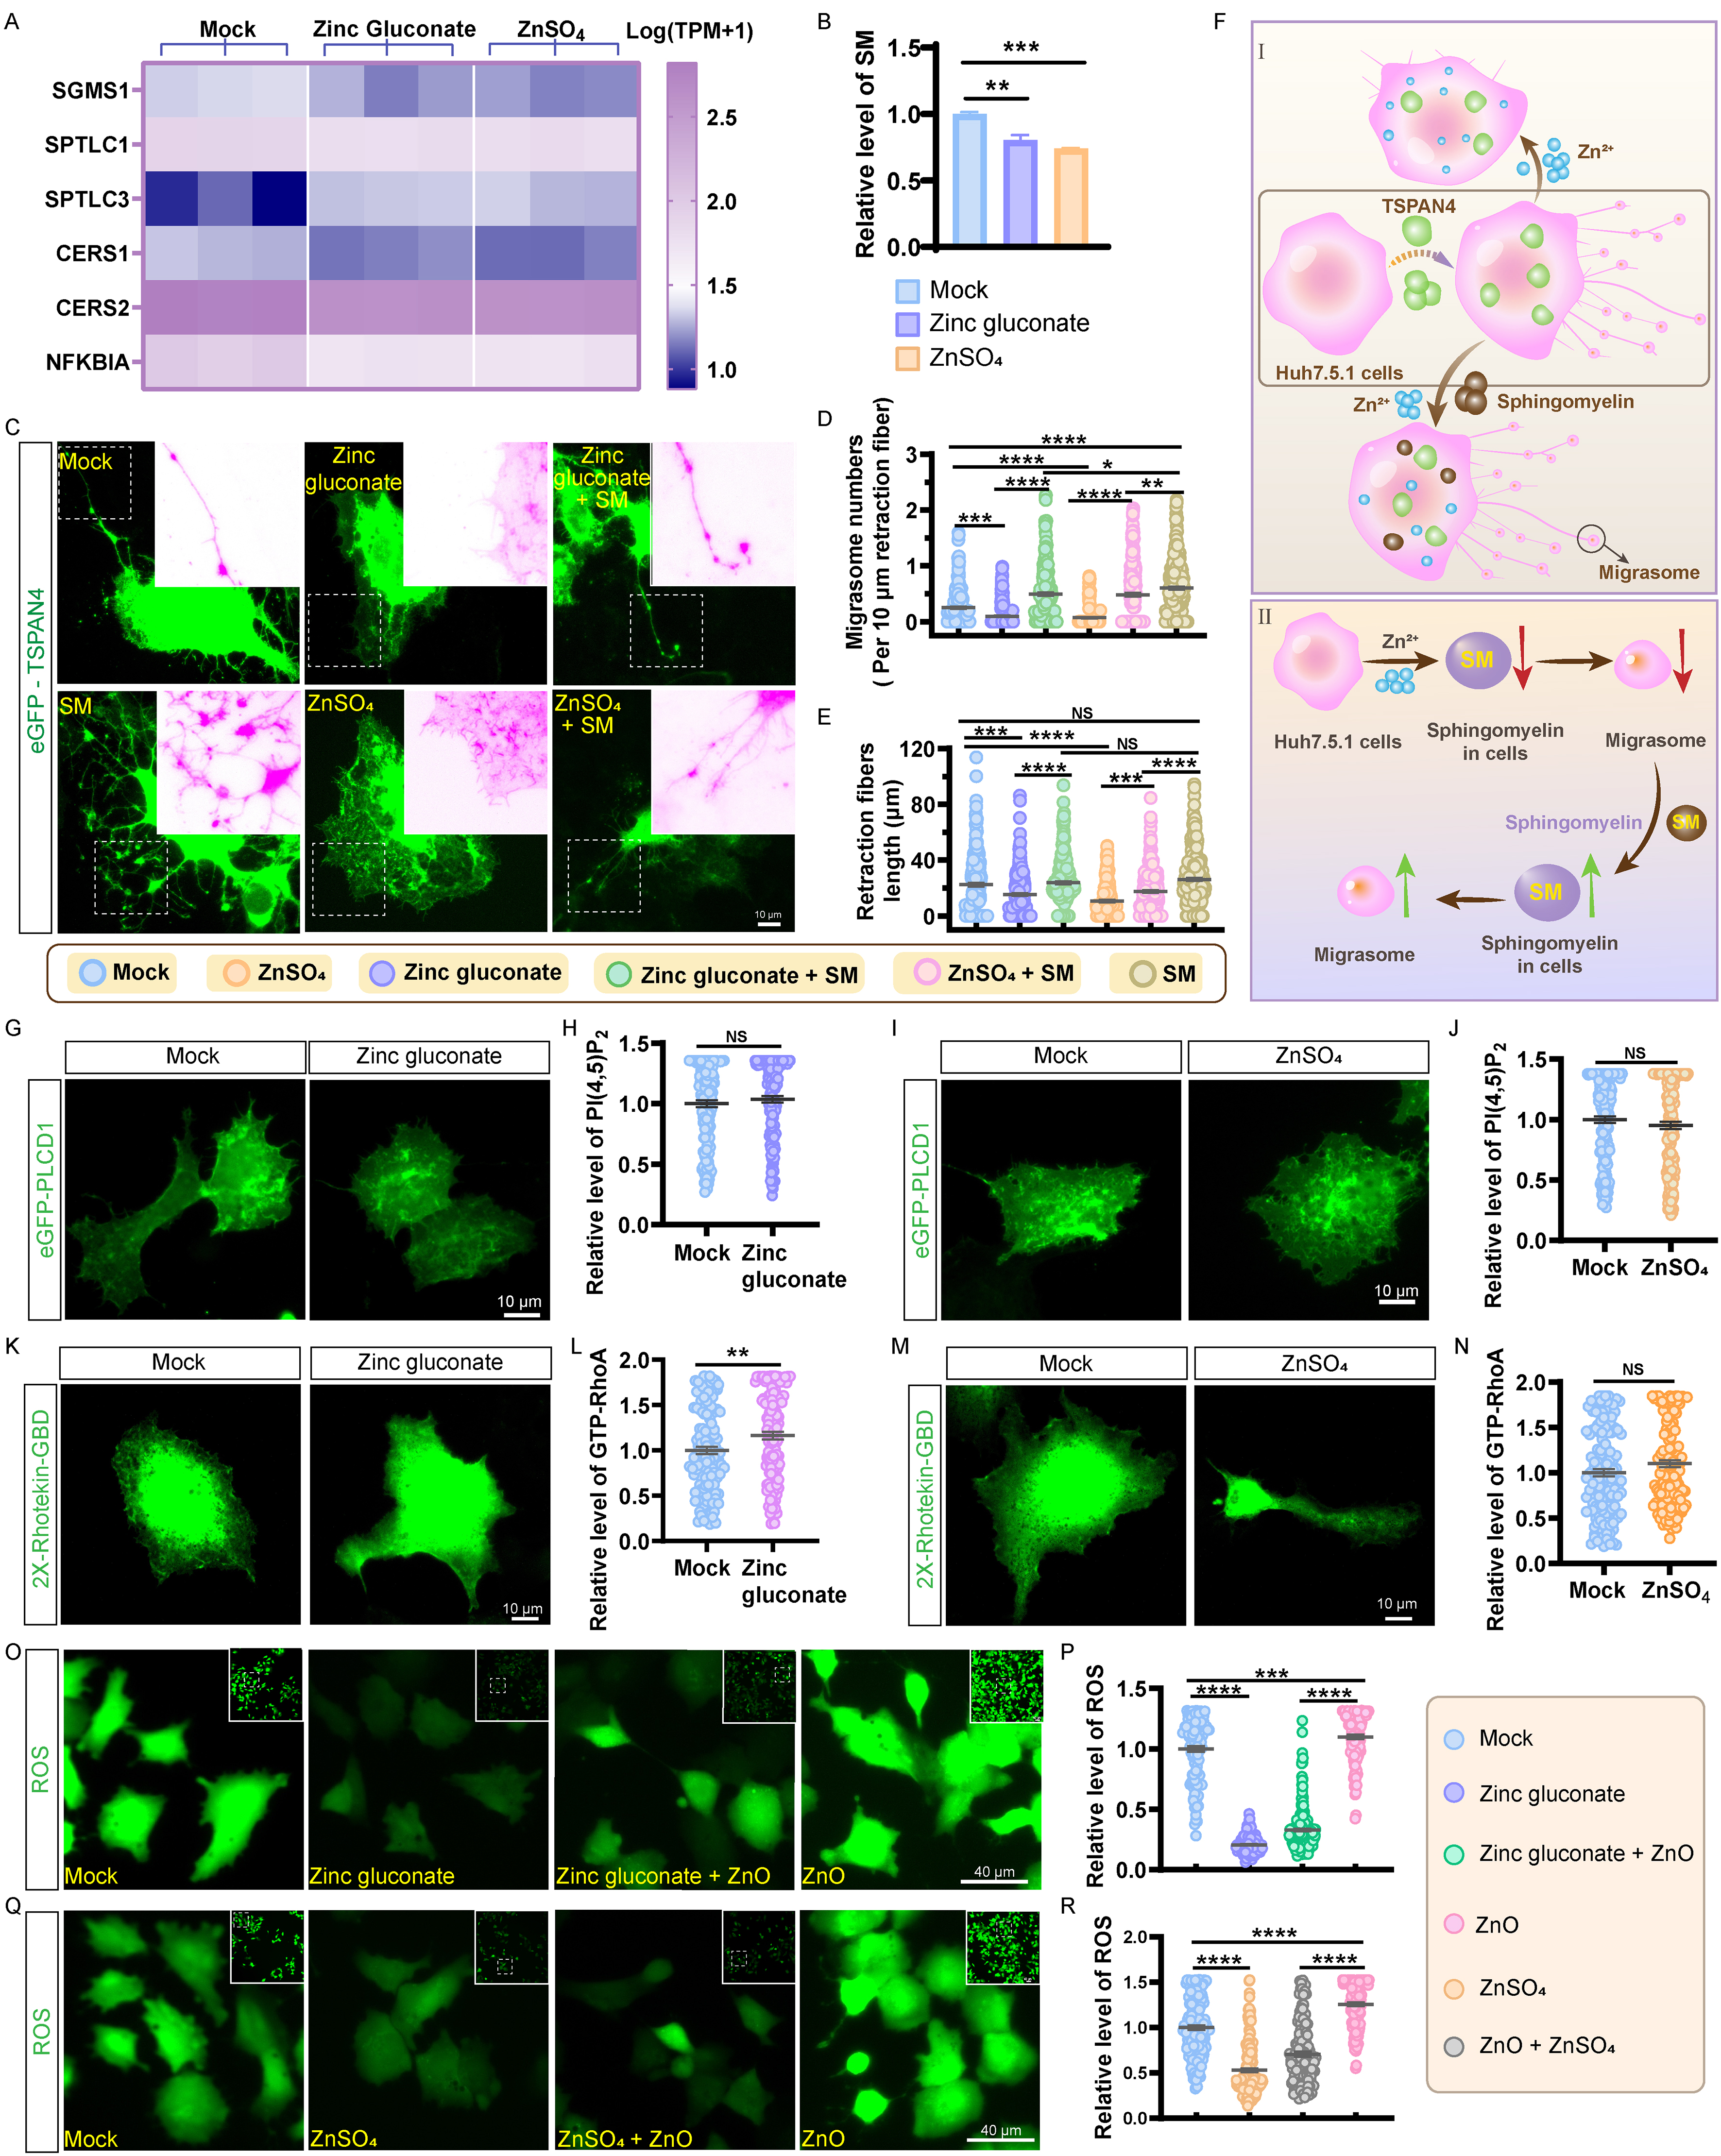
Figure 7. Zinc ions downregulate sphingomyelin levels. (A) Expression levels of gene clusters involved in sphingomyelin metabolism; (B) Relative sphingomyelin levels in Huh7.5.1 cells incubated with 20 μmol/L zinc gluconate and 20 μmol/L ZnSO4 for 17 h. Values are derived from three independent experiments; (C) Images of eGFP-TSPAN4-expressing Huh7.5.1 cells incubated with 20 μmol/L zinc gluconate, 20 μmol/L ZnSO4, zinc gluconate with sphingomyelin, ZnSO4 with sphingomyelin, and 10 μmol/L sphingomyelin for 17 h. Scale bar: 10 µm; (D) Statistical evaluation of migrasome counts per 10 μm retraction fibers is shown in (C). For each group, at least 200 cells were analyzed across three independent experiments; (E) Statistical analyses of retraction fiber lengths in (C). For each group, at least 200 cells were analyzed across three independent experiments; (F) Schematic diagram showing that zinc ions inhibit migrasome formation, and that sphingomyelin replenishment partially reverses this inhibition; (G) Representative images of PH-eGFP-PLCD1-expressing Huh7.5.1 cells were incubated with or without zinc gluconate, and representative images are shown. Scale bar: 10 µm; (H) Statistical analysis of (G). For each group, at least 139 cells were analyzed across three independent experiments; (I) Representative images of PH-eGFP-PLCD1-expressing Huh7.5.1 cells incubated with ZnSO4. Scale bar: 10 µm; (J) Data in (I) were statistically analyzed using more than 166 cells in every group across three independent experiments; (K) Huh7.5.1 cells expressing eGFP-2X-Rhotekin-GBD incubated with or without zinc gluconate for 17 h. Scale bar: 10 µm; (L) Data in (K) were statistically analyzed using more than 129 cells in every group across three independent experiments; (M) Huh7.5.1 cells expressing eGFP-2X-Rhotekin-GBD incubated with ZnSO4 for 17 h. Scale bar: 10 µm; (N) Data in (M) were statistically analyzed using more than 142 cells in every group across three independent experiments; (O) Huh7.5.1 cells were incubated for 17 h with 20 μmol/L zinc gluconate, 20 μg/mL 30 nm ZnO-NPs, or a combination of zinc gluconate and ZnO-NPs, and then labeled with DCFH-DA to assess ROS levels. Scale bar: 40 µm; (P) Statistical analysis of relative ROS levels in zinc gluconate-treated cells. For each group, at least 117 cells were analyzed across three independent experiments; (Q) Huh7.5.1 cells were incubated for 17 h with 20 μmol/L ZnSO4, 20 μg/mL 30 nm ZnO-NPs, or a combination of ZnSO4 and ZnO-NPs, and then labeled with DCFH-DA to assess ROS levels. Scale bar: 40 µm; (R) Statistical analysis of relative ROS levels in ZnSO4-treated cells. For each group, at least 132 cells were analyzed across three independent experiments. Data are shown as mean ± SEM. NS denotes P > 0.05; *P < 0.05; **P < 0.01; ***P < 0.001; ****P < 0.0001. DCF: 2’,7’-dichlorofluorescein; DCFH-DA: 2’,7’-dichlorodihydrofluorescein diacetate; eGFP: enhanced green fluorescent protein; GBD: GTPase-binding domain; GFP: green fluorescent protein; NS: not significant; PH: pleckstrin homology domain; PI(4,5)P2: phosphatidylinositol 4,5-bisphosphate; PLCD1: phospholipase C delta 1; RhoA: Ras homolog family member A; ROS: reactive oxygen species; SEM: standard error of the mean; SM: sphingomyelin; TPM: transcripts per million; TSPAN4: tetraspanin 4; ZnO: zinc oxide; ZnO-NPs: zinc oxide nanoparticles.