
fig1
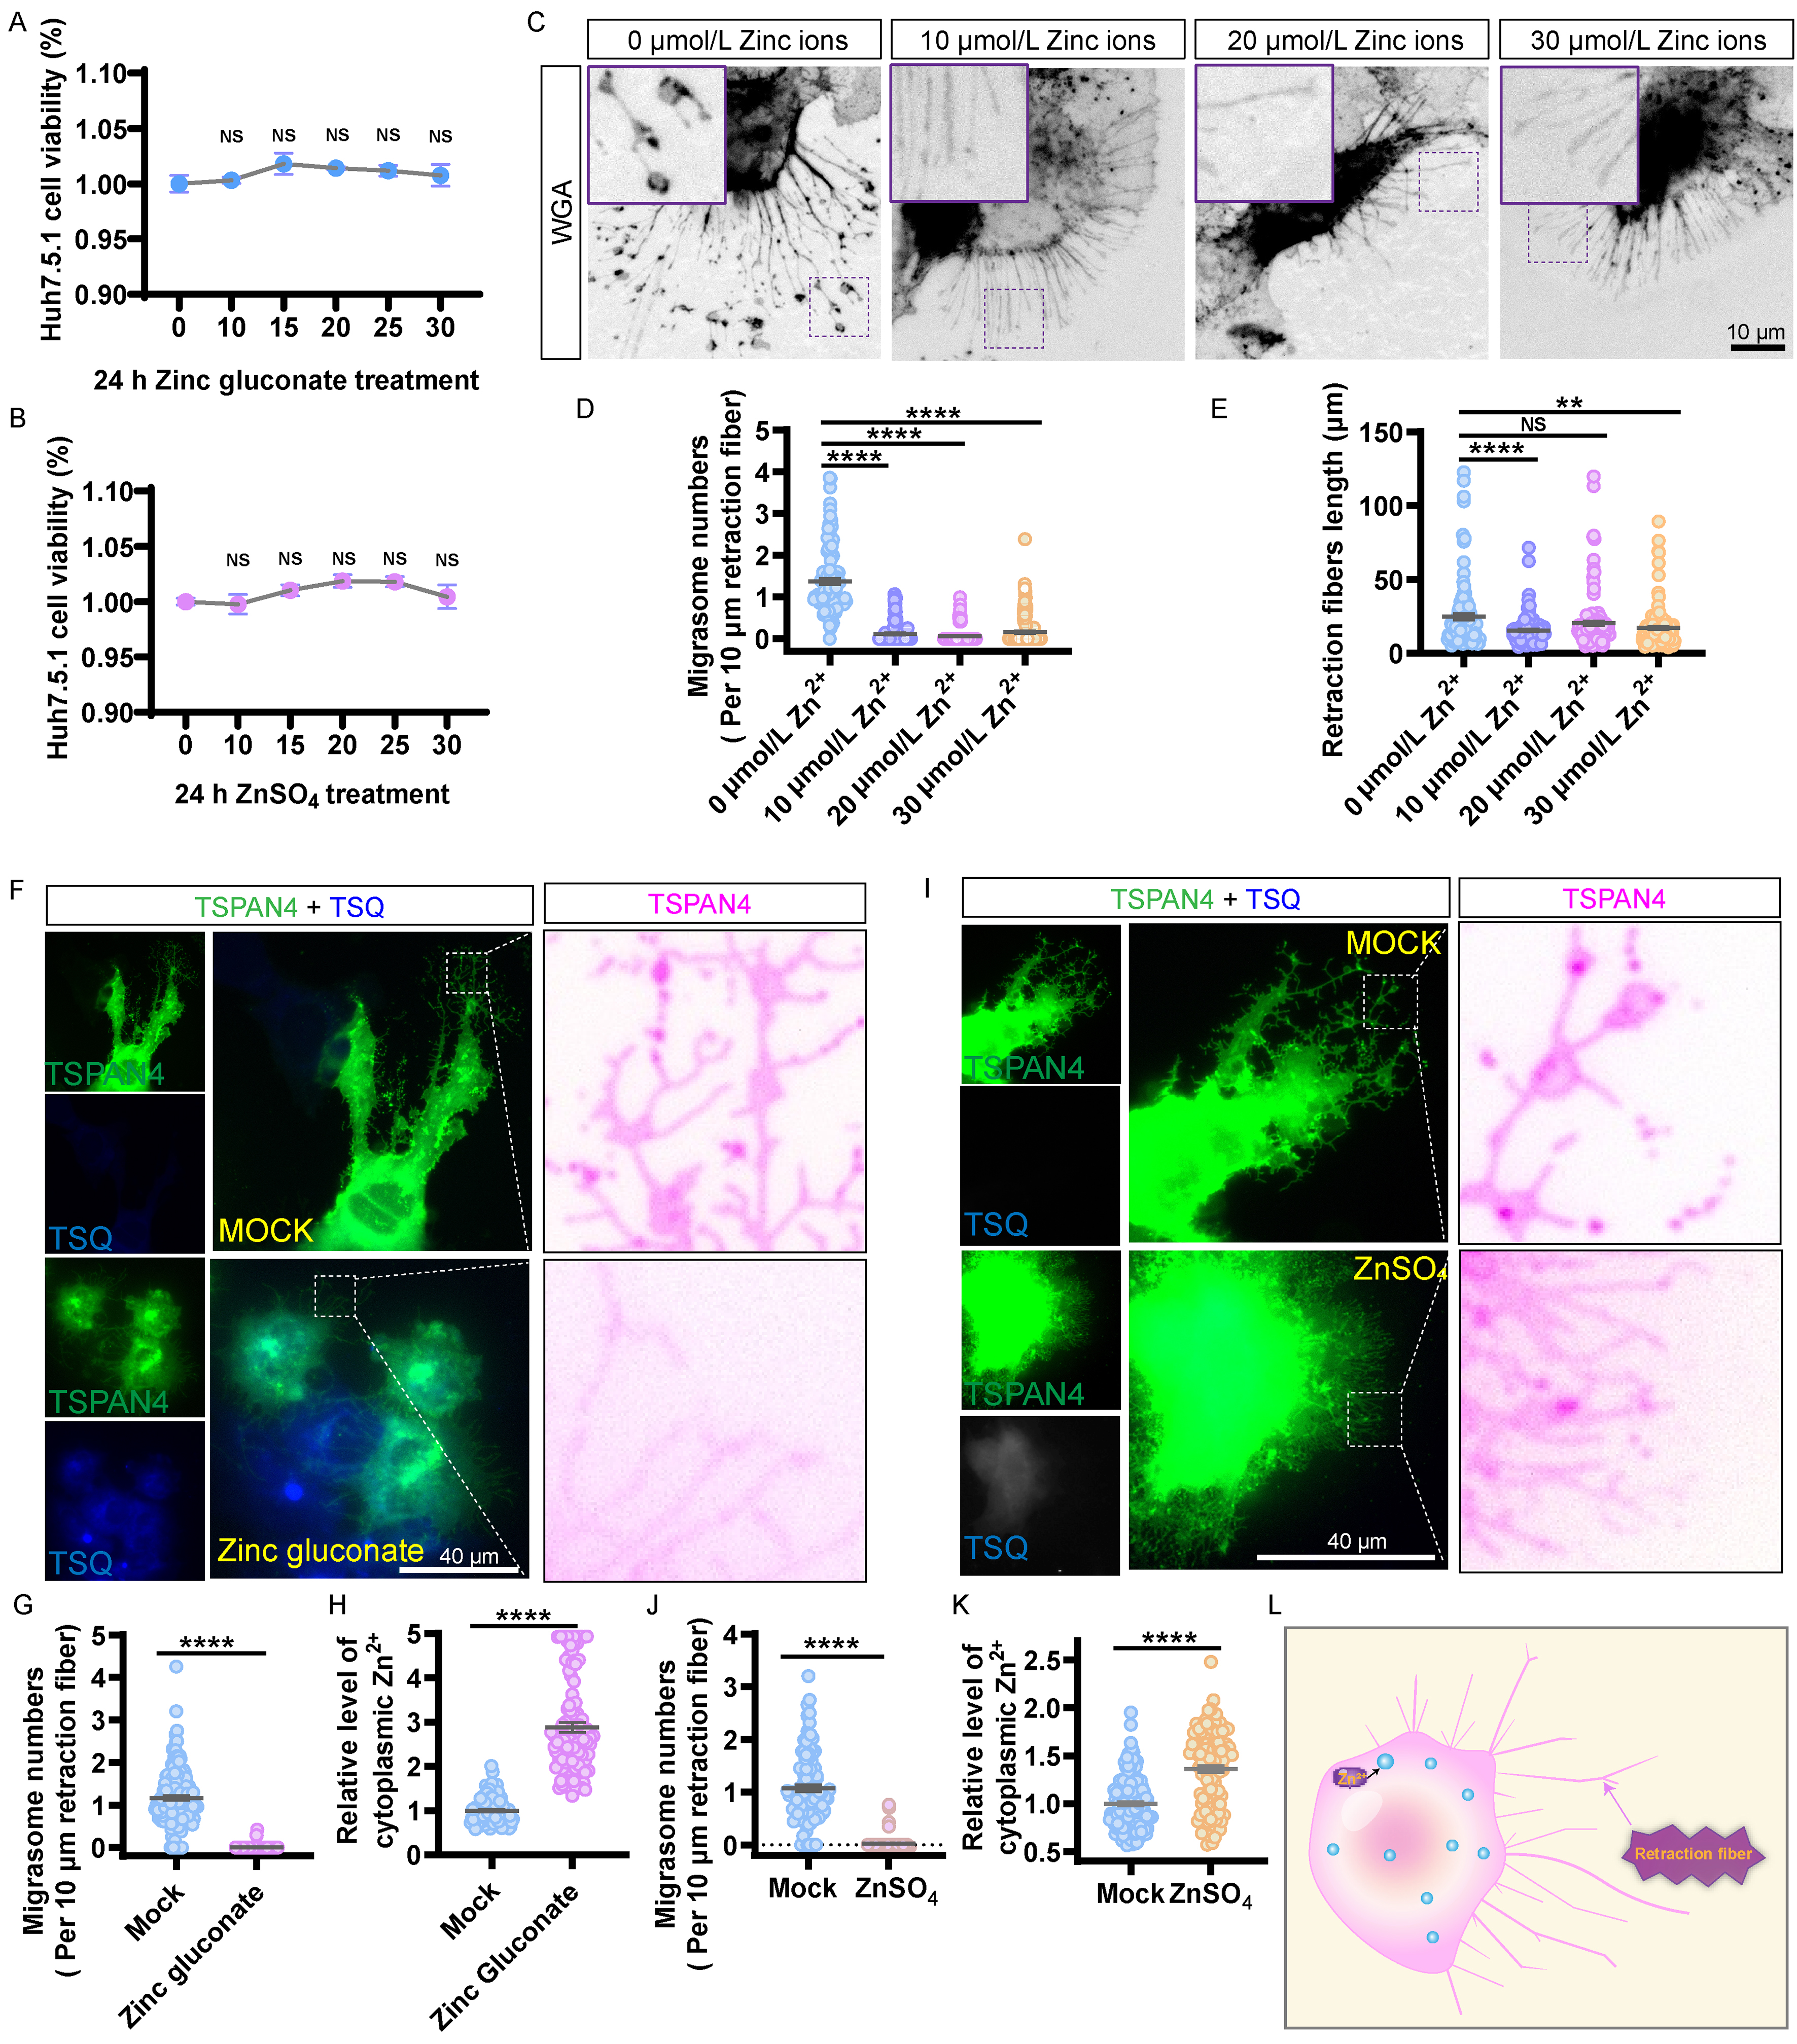
Figure 1. Zinc ions inhibit migrasome formation. (A) Viability of Huh7.5.1 cells exposed to increasing concentrations of zinc gluconate (0-30 μmol/L) for 24 h, as evaluated by the CCK-8 viability assay. Values are derived from five independent experiments; (B) Viability of Huh7.5.1 cells exposed to increasing concentrations of ZnSO4 (0-30 μmol/L) for 24 h, as evaluated by the CCK-8 viability assay; (C) Photomicrographs of Huh7.5.1 cells stained with WGA following treatment with varying concentrations of zinc ions (0 to 30 μmol/L) for 17 h. Scale bar: 10 µm; (D and E) Statistical data from (C) include migrasome counts per 10 μm retraction fibers (D) and the lengths of retraction fibers (E). For each group, at least 107 cells were analyzed across three independent experiments; (F) Images of eGFP-TSPAN4-expressing Huh7.5.1 cells incubated with 20 μmol/L zinc gluconate for 17 h and stained with TSQ as a zinc ion marker. A magnified view highlights the migrasomes and retraction fibers in eGFP-TSPAN4-expressing Huh7.5.1 cells. Scale bar: 40 µm; (G) Statistical data from (F) include migrasome counts per 10 μm retraction fibers. For each group, at least 116 cells were analyzed across three independent experiments; (H) Statistical analyses of relative level of cytoplasmic zinc in (F). For each group, at least 103 cells were analyzed across three independent experiments; (I) Images of Huh7.5.1 cells expressing eGFP-TSPAN4 incubated with 20 μmol/L ZnSO4 for 17 h and stained with TSQ as a zinc ion marker. A magnified view illustrates the migrasomes and retraction fibers in Huh7.5.1 cells expressing eGFP-TSPAN4. Scale bar: 40 µm; (J) Statistical analyses of migrasome counts per 10 μm retraction fibers in (I). For each group, at least 104 cells were analyzed across three independent experiments; (K) Statistical analyses of relative level of cytoplasmic zinc in (I). For each group, at least 113 cells were analyzed across three independent experiments. Data are shown as mean ± SEM. NS denotes P > 0.05; *P < 0.05; **P < 0.01; ***P < 0.001; ****P < 0.0001. (L) Diagram showing zinc ions inhibit migrasome formation. CCK-8: Cell counting Kit-8; eGFP: enhanced green fluorescent protein; NS: not significant; SEM: standard error of the mean; TSPAN4: tetraspanin 4; TSQ: N-(6-methoxy-8-quinolyl)-p-toluenesulfonamide; WGA: wheat germ agglutinin.