


fig4
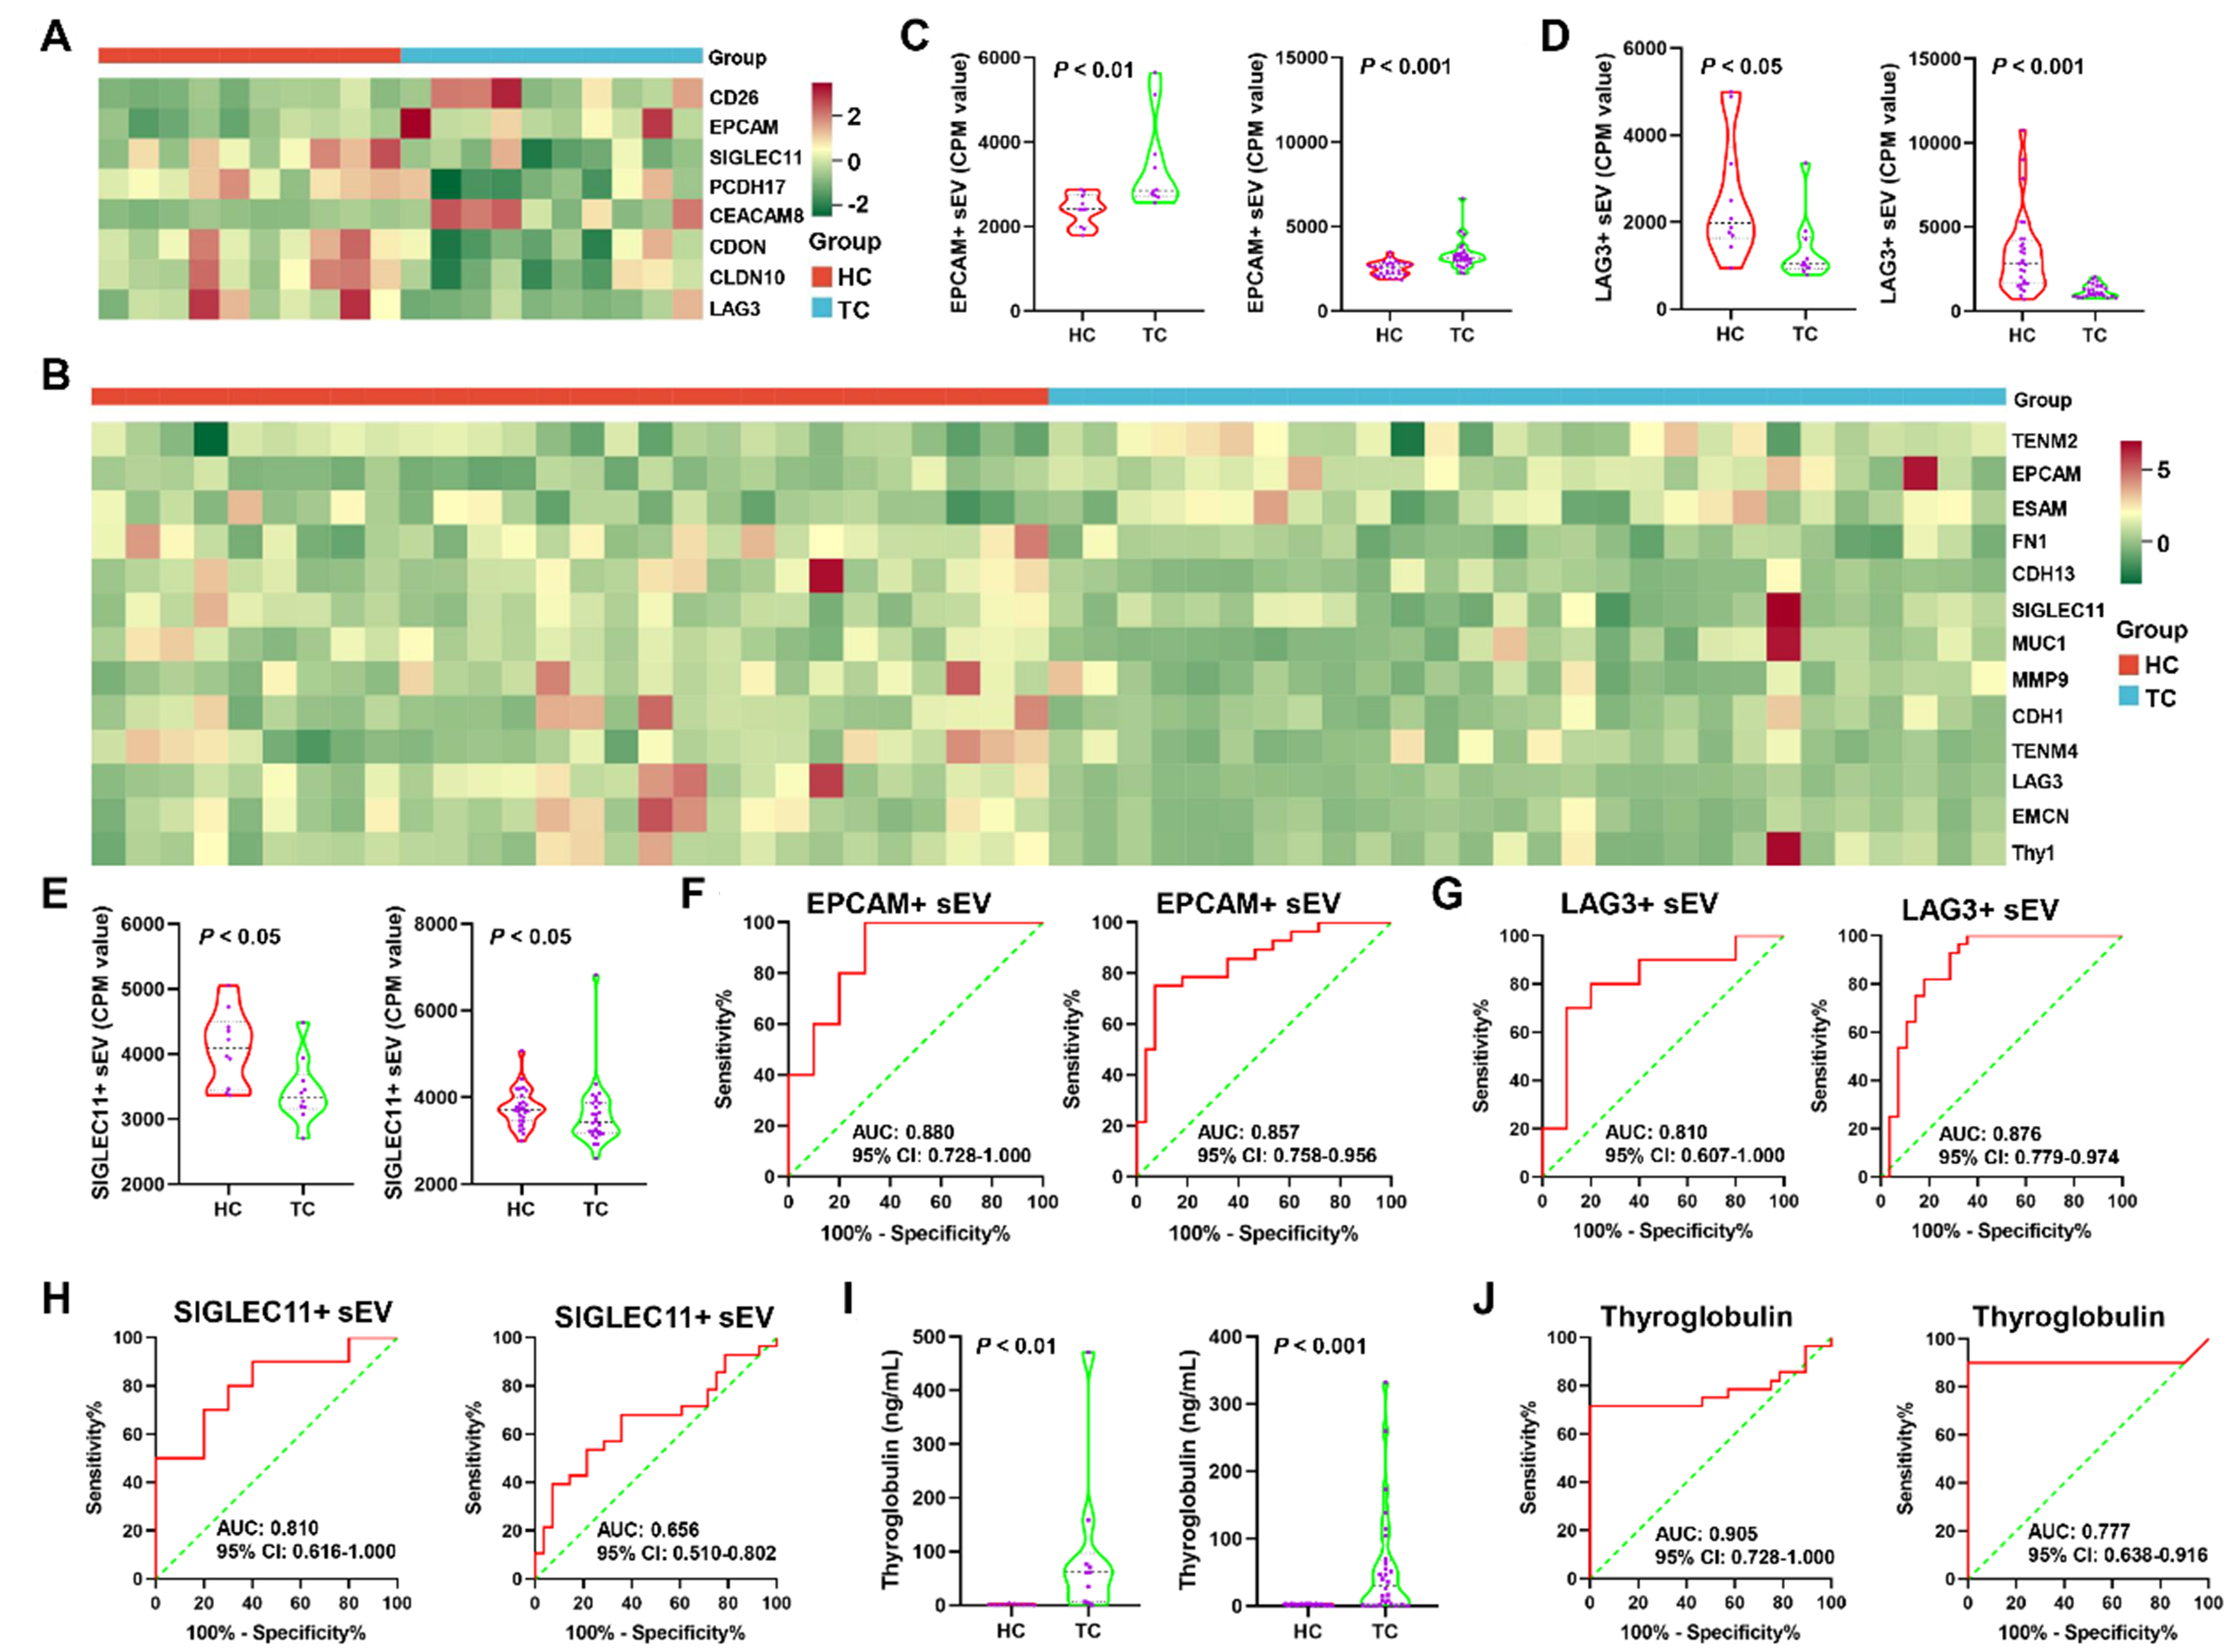
Figure 4. Identification of plasma sEV subpopulation biomarkers for early diagnosis of TC. The differential plasma sEV subpopulations between HC and TC in Cohort 1 (A) and 2 (B) were displayed in the two heatmaps; The CPM values of EPCAM+ (C), and LAG3+ (D), SIGLEC11+ (E) sEVs were compared between HC and TC in Cohort 1 (left panel) and 2 (right panel). The data of EPCAM+ and LAG3+ sEVs in both cohorts was analyzed using the Mann‒Whitney U test. The data of SIGLEC11+ sEVs in cohort 1 and 2 was analyzed using the Student’s t-test and the Mann‒Whitney U test, respectively; ROC curves for EPCAM+ (F), and LAG3+ (G), SIGLEC11+ (H) sEVs in Cohort 1 (left panel) and 2 (right panel) were plotted; (I) The conventional biomarker, serum Tg, was compared between HC and TC in Cohort 1 (left panel) and 2 (right panel). The data of serum Tg in both cohorts was analyzed using the Mann‒Whitney U test; (J) ROC analysis of Tg in Cohort 1 (left panel) and 2 (right panel). sEV: Small extracellular vesicle; TC: thyroid carcinoma; HC: healthy controls; CPM: counts per million; EPCAM: epithelial cell adhesion molecule; LAG3: lymphocyte-activating 3; SIGLEC11: sialic acid-binding Ig-like lectin 11; ROC: receiver operating characteristic; Tg: thyroglobulin; AUC: area under the curve; CI: confidence interval.


