


fig5
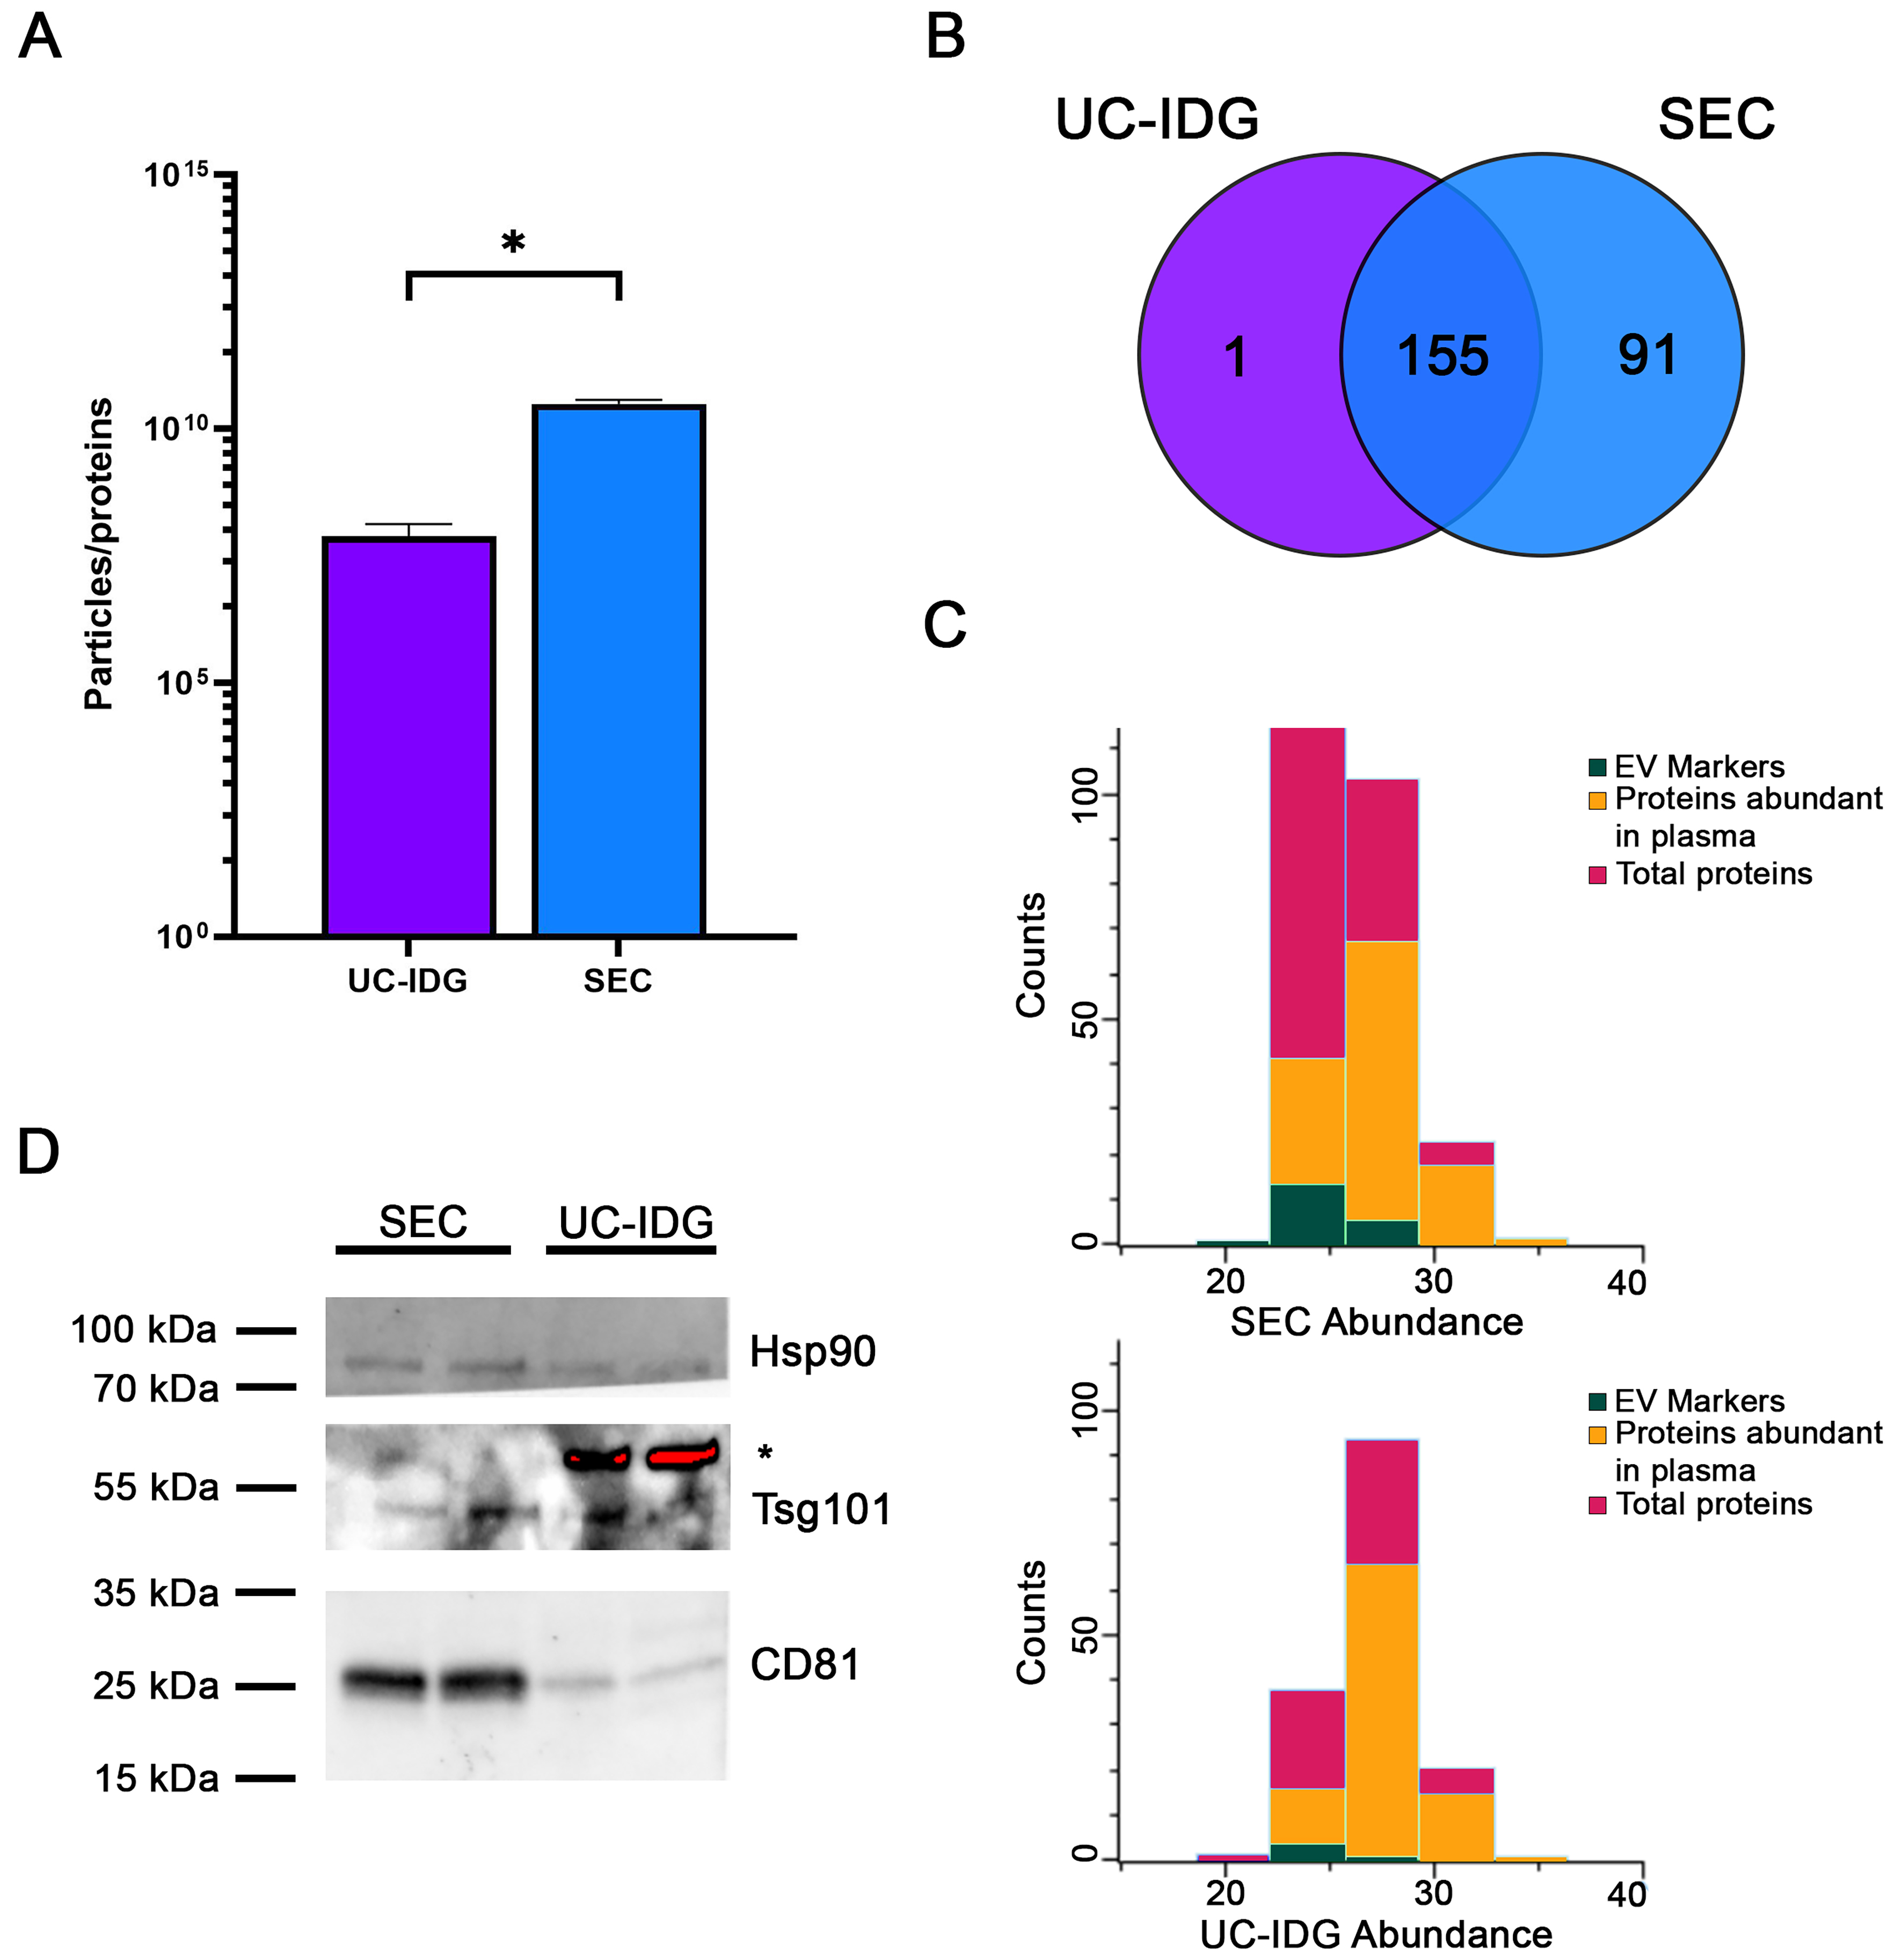
Figure 5. Proteomic analysis by Mass Spectrometry. (A) Graph shows particles per protein, obtained by dividing the number of particles counted by NTA by the protein amount measured using BCA. This ratio is an indication of sample purity; (B) Venn diagram analysis of proteins identified by Mass Spectrometry of sEVs isolated by UC-IDG and SEC; (C) Representation of proteins profiled by LC/MS. In red are total proteins; green the EV markers; in orange the plasma abundant proteins. For all graphs, data is presented as mean ± SEM; n (independent biological replicates) = 3. *P < 0.05; (D) Representative image of western blot analysis of SEC and UC-IDG samples showing levels of some known and accepted EV markers. *indicates an unspecific band. NTA: Nanoparticle tracking analysis; BCA: bicinchoninic acid; sEVs: small extracellular vesicles; UC-IDG: ultracentrifugation followed by iodixanol density gradient; SEC: size exclusion chromatography; LC/MS: liquid chromatography/mass spectrometry; EV: extracellular vesicle; SEM: standard error of mean.


