


fig4
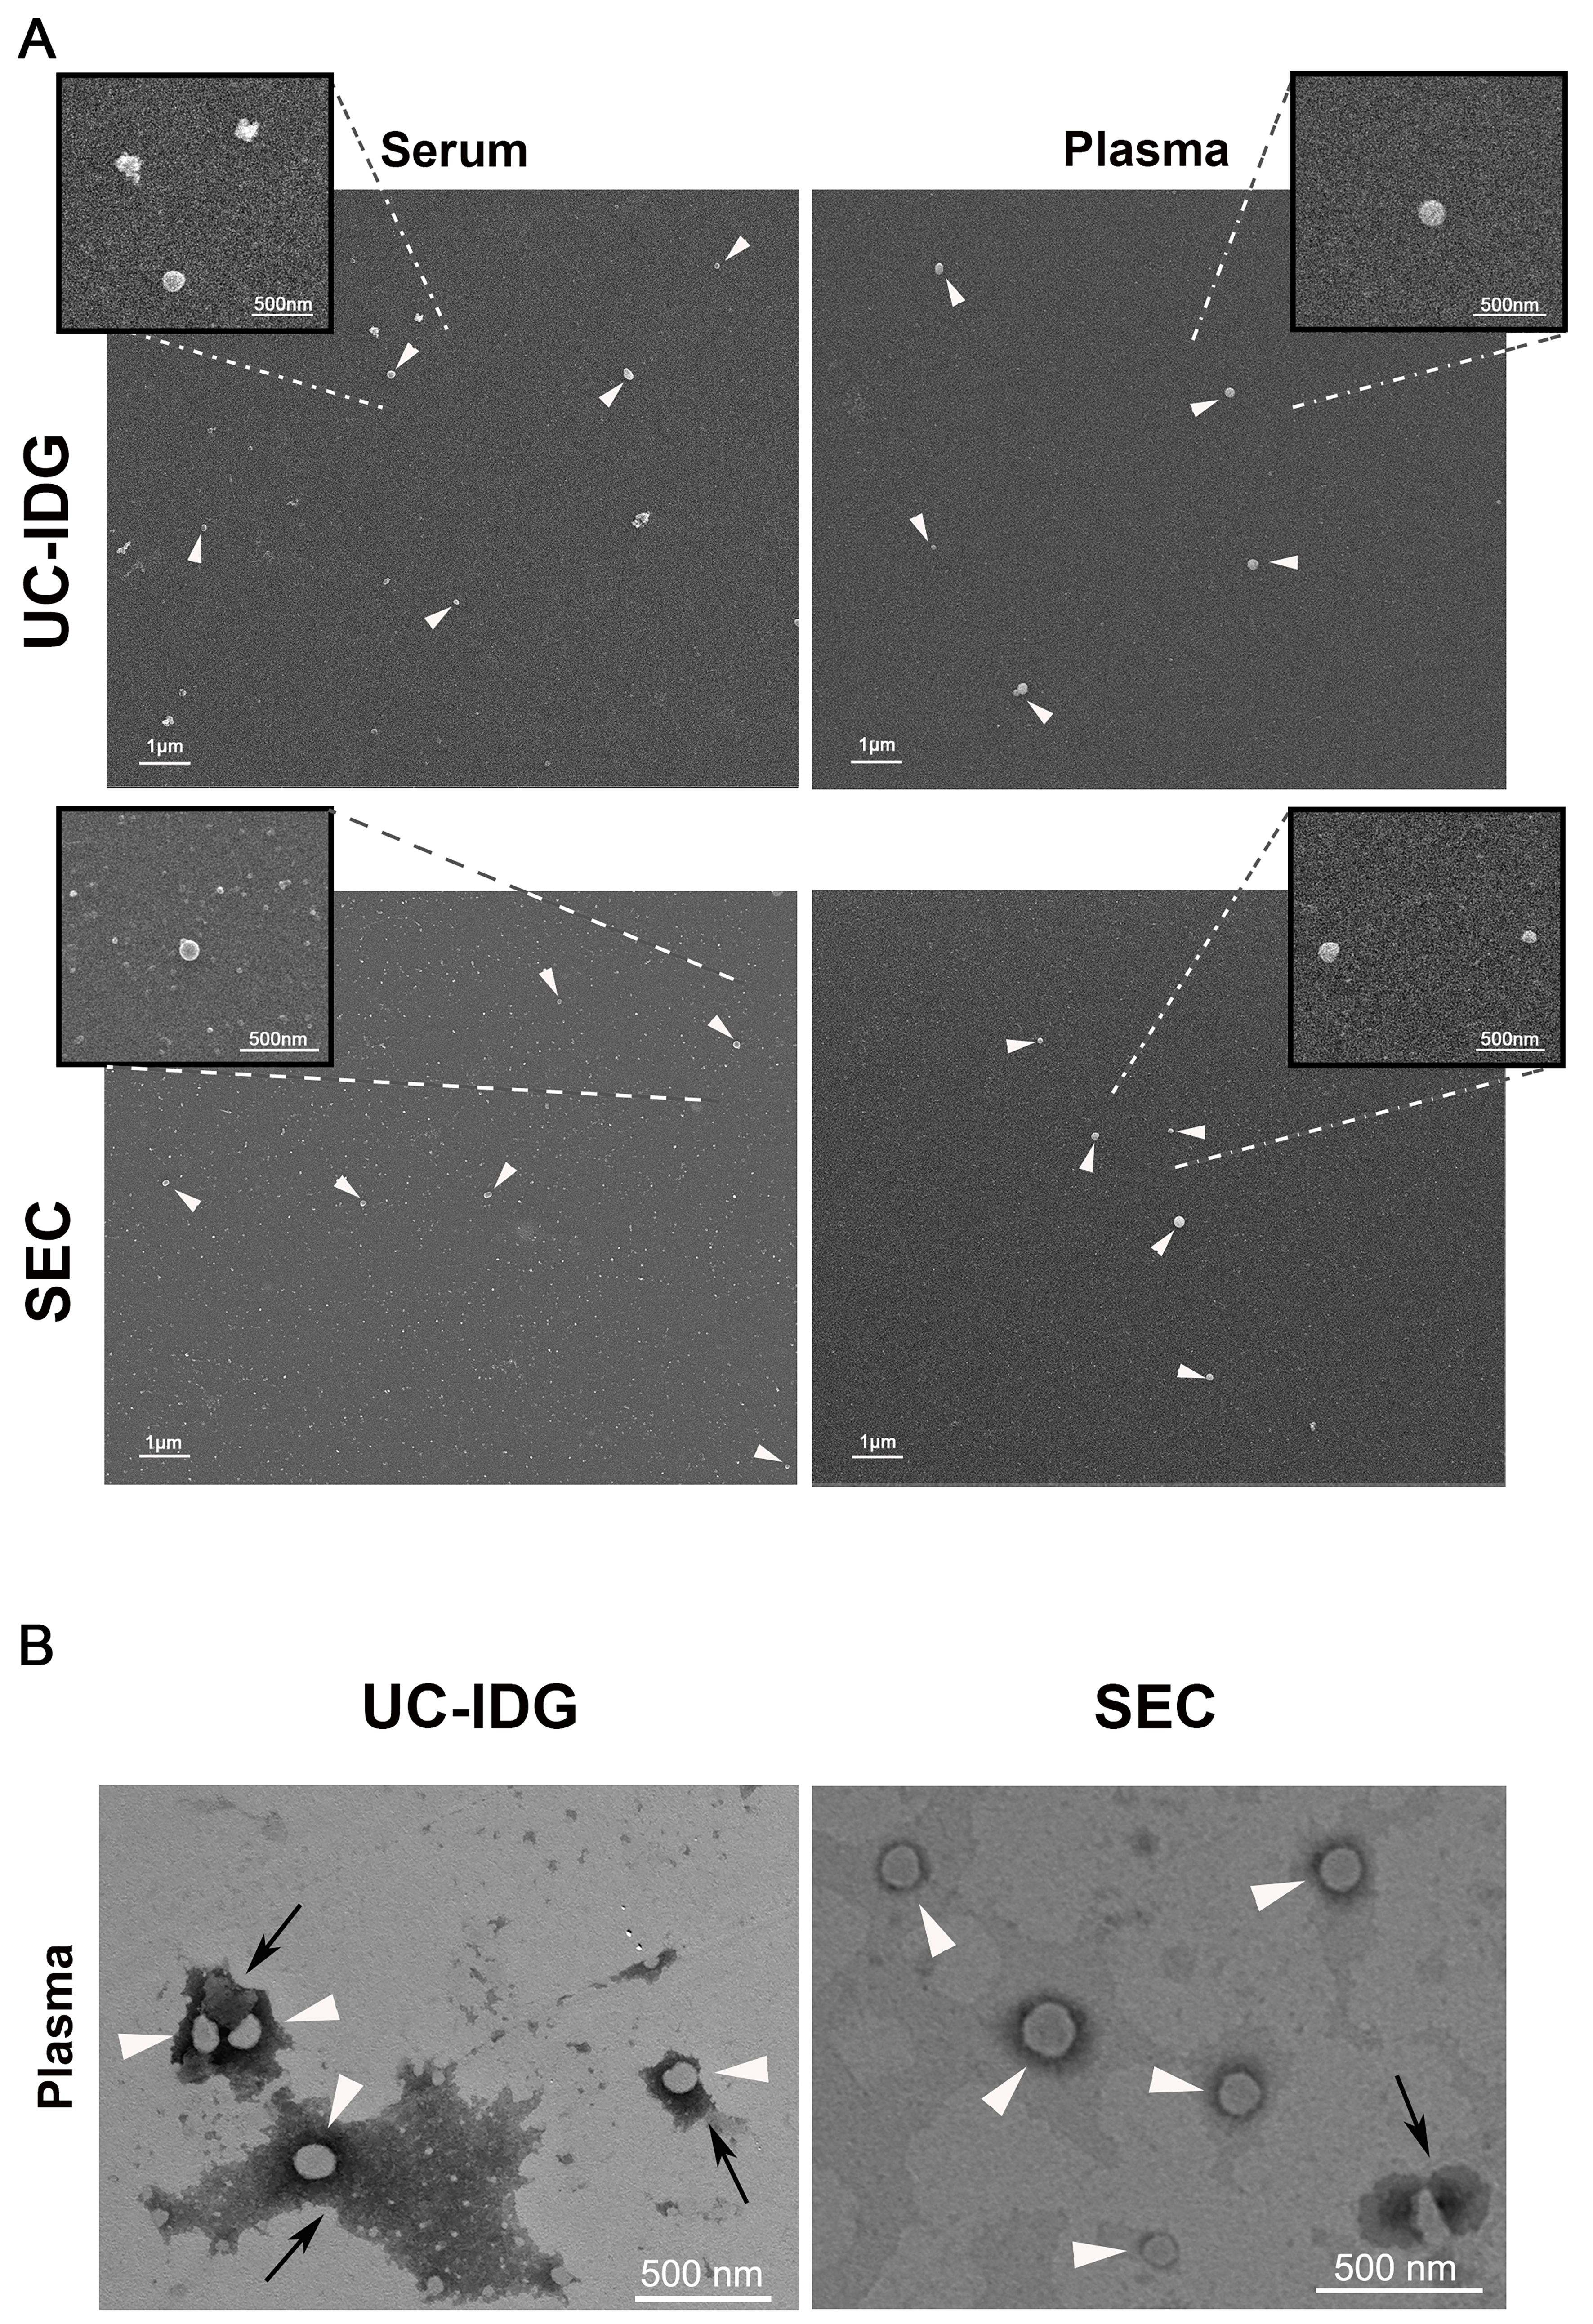
Figure 4. Evaluation of sEV morphology by electron microscopy. (A) SEM micrographs of sEV pellets derived from serum or plasma samples, isolated by UC-IDG or SEC (scale bar 1 µm). Inserts represent higher magnification images of the selected region of interest, showing sEVs (scale bar 500 nm); (B) TEM observation of vesicles obtained by plasma UC-IDG and SEC showing the lipid bilayer-enclosed structure (white arrows) and protein aggregates (black arrows). UC-IDG: Ultracentrifugation followed by iodixanol density gradient; SEC: size exclusion chromatography; sEV: small extracellular vesicle; SEM: scanning electron microscopy; TEM: transmission electron microscopy.


