


fig3
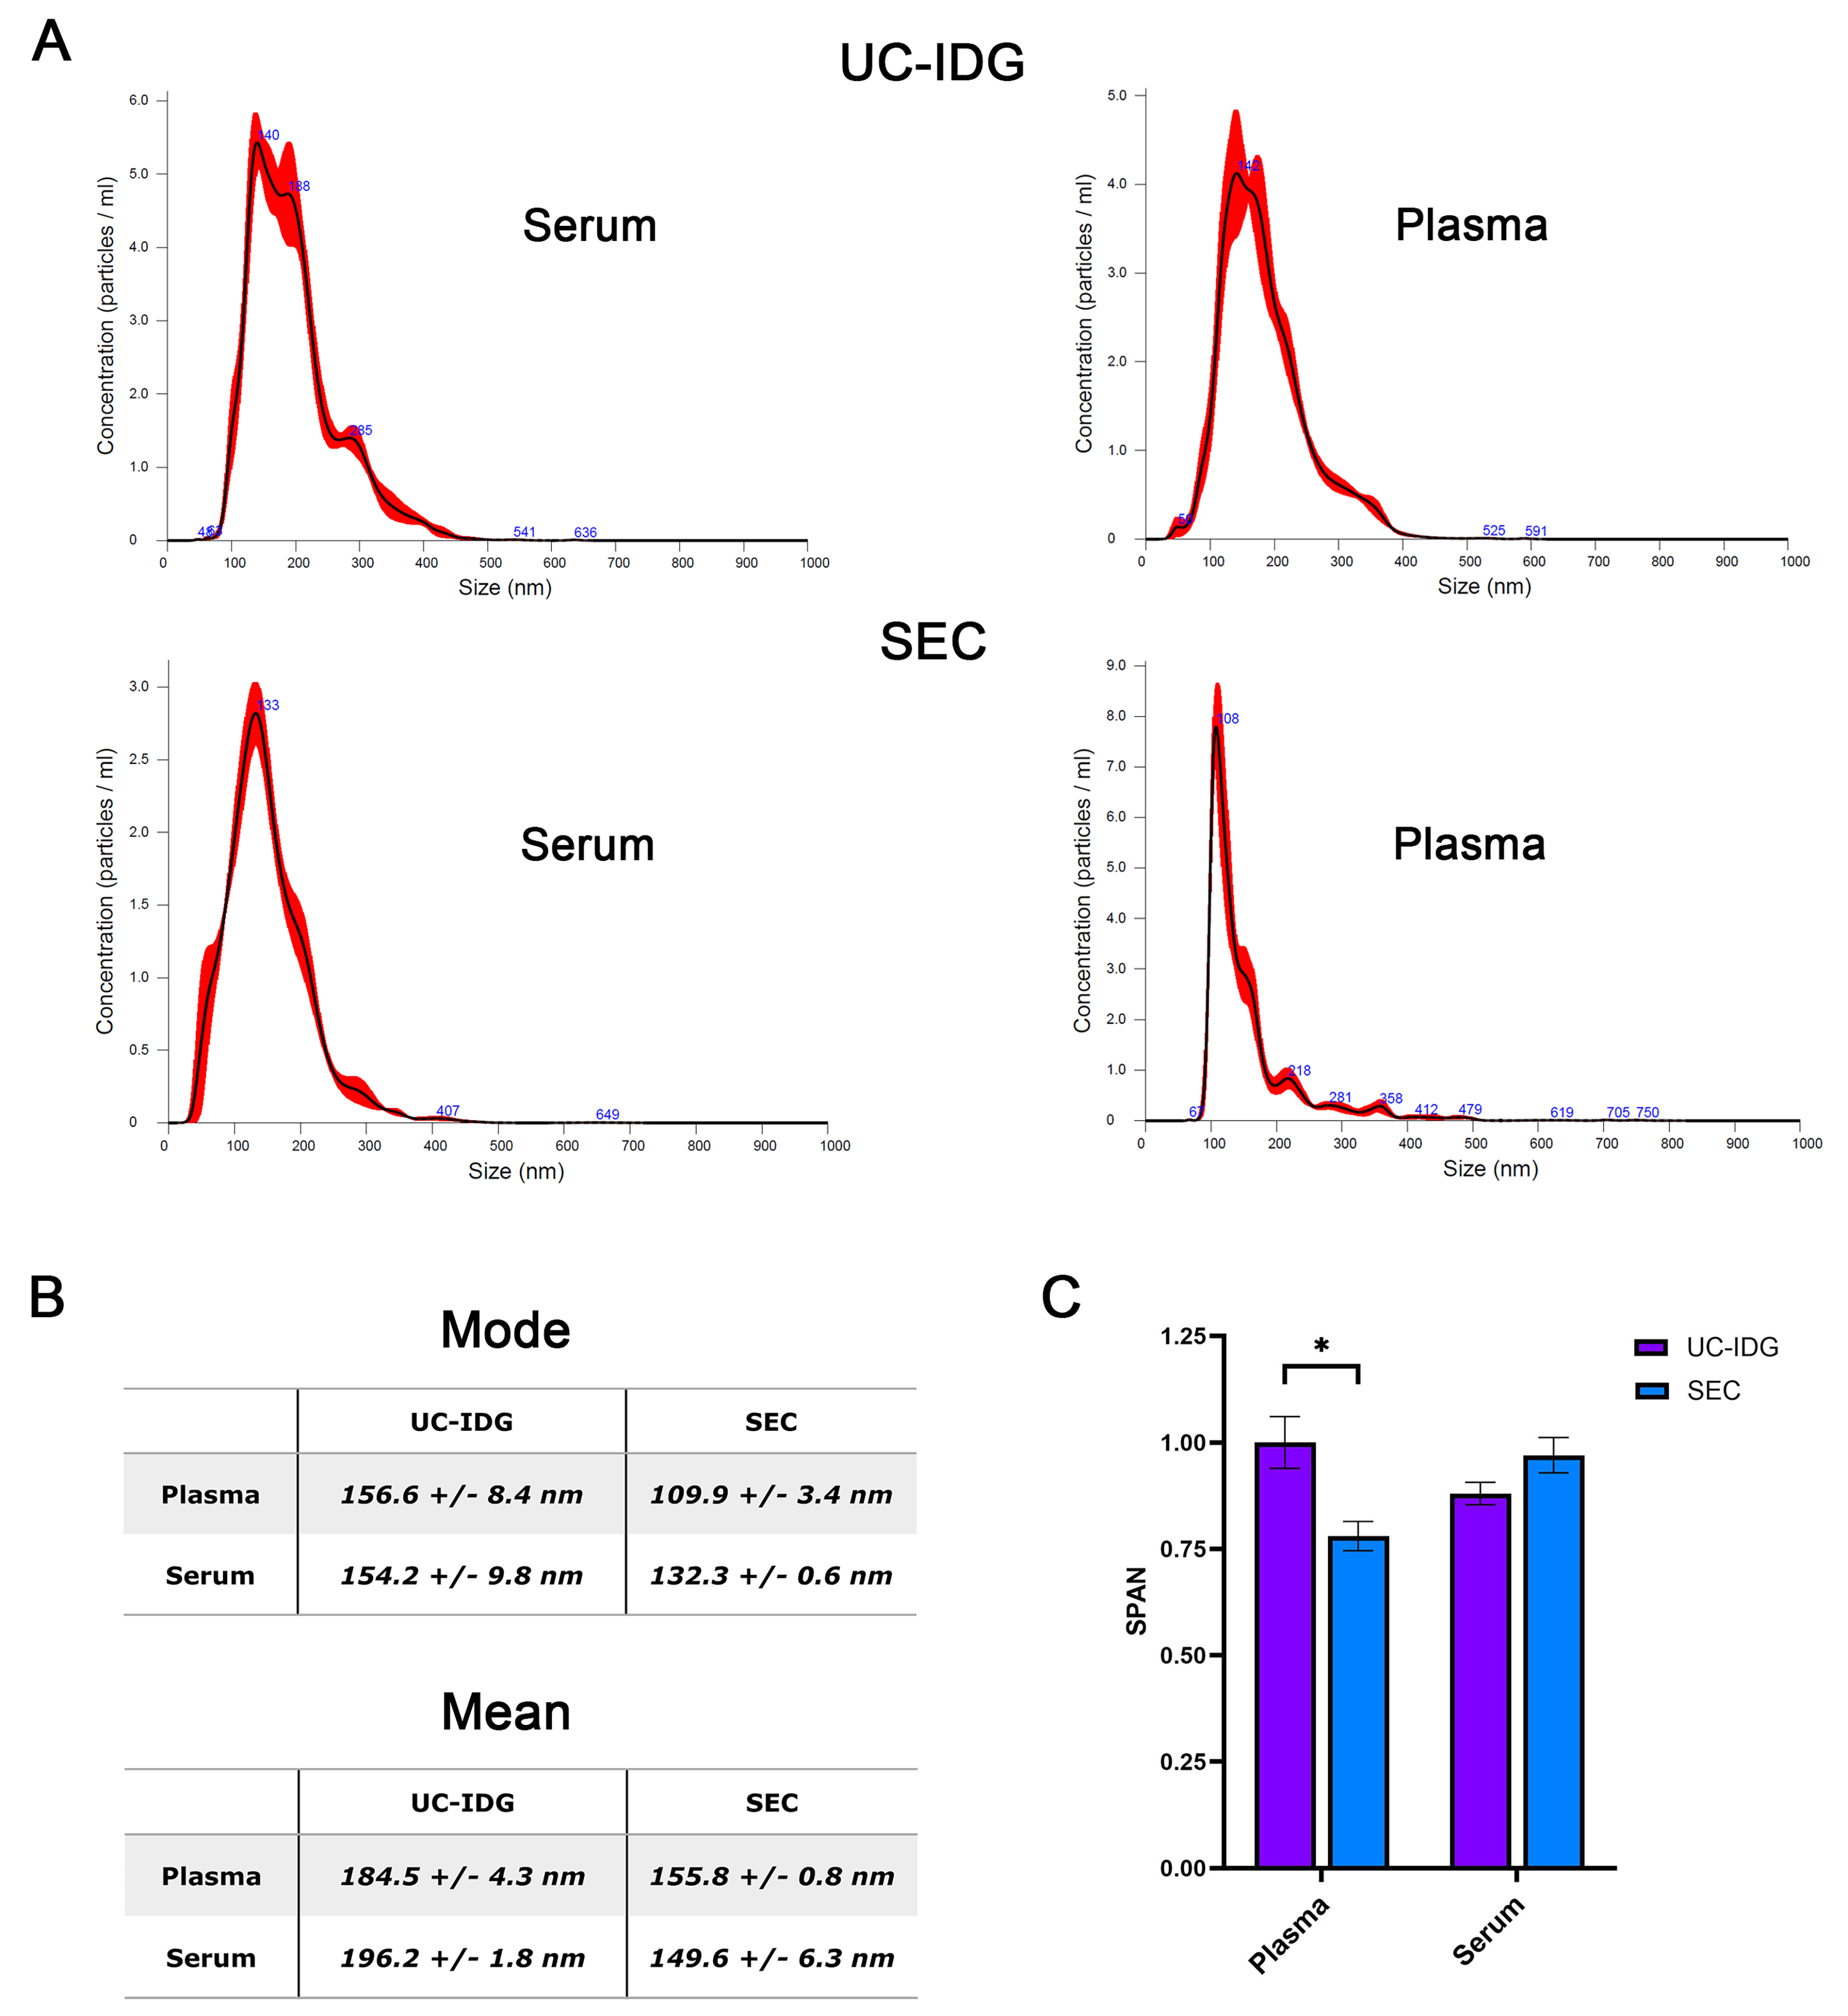
Figure 3. Particle distribution evaluated by NTA. (A) Size distribution in the most represented fraction (Fr. 1,1659 g/mL for UC-IDG and fraction 3 for SEC) as assessed by NTA. The mean and the median particle size are represented in (B). SPAN, derived from NTA size distribution values [(D90-D10)/D50] was calculated for each sample and represented in (C). Data presented as mean ± SEM; n (independent biological replicates) = 3. *P < 0.05. UC-IDG: Ultracentrifugation followed by iodixanol density gradient; SEC: size exclusion chromatography; NTA: nanoparticle tracking analysis; SEM: standard error of mean.


