


fig2
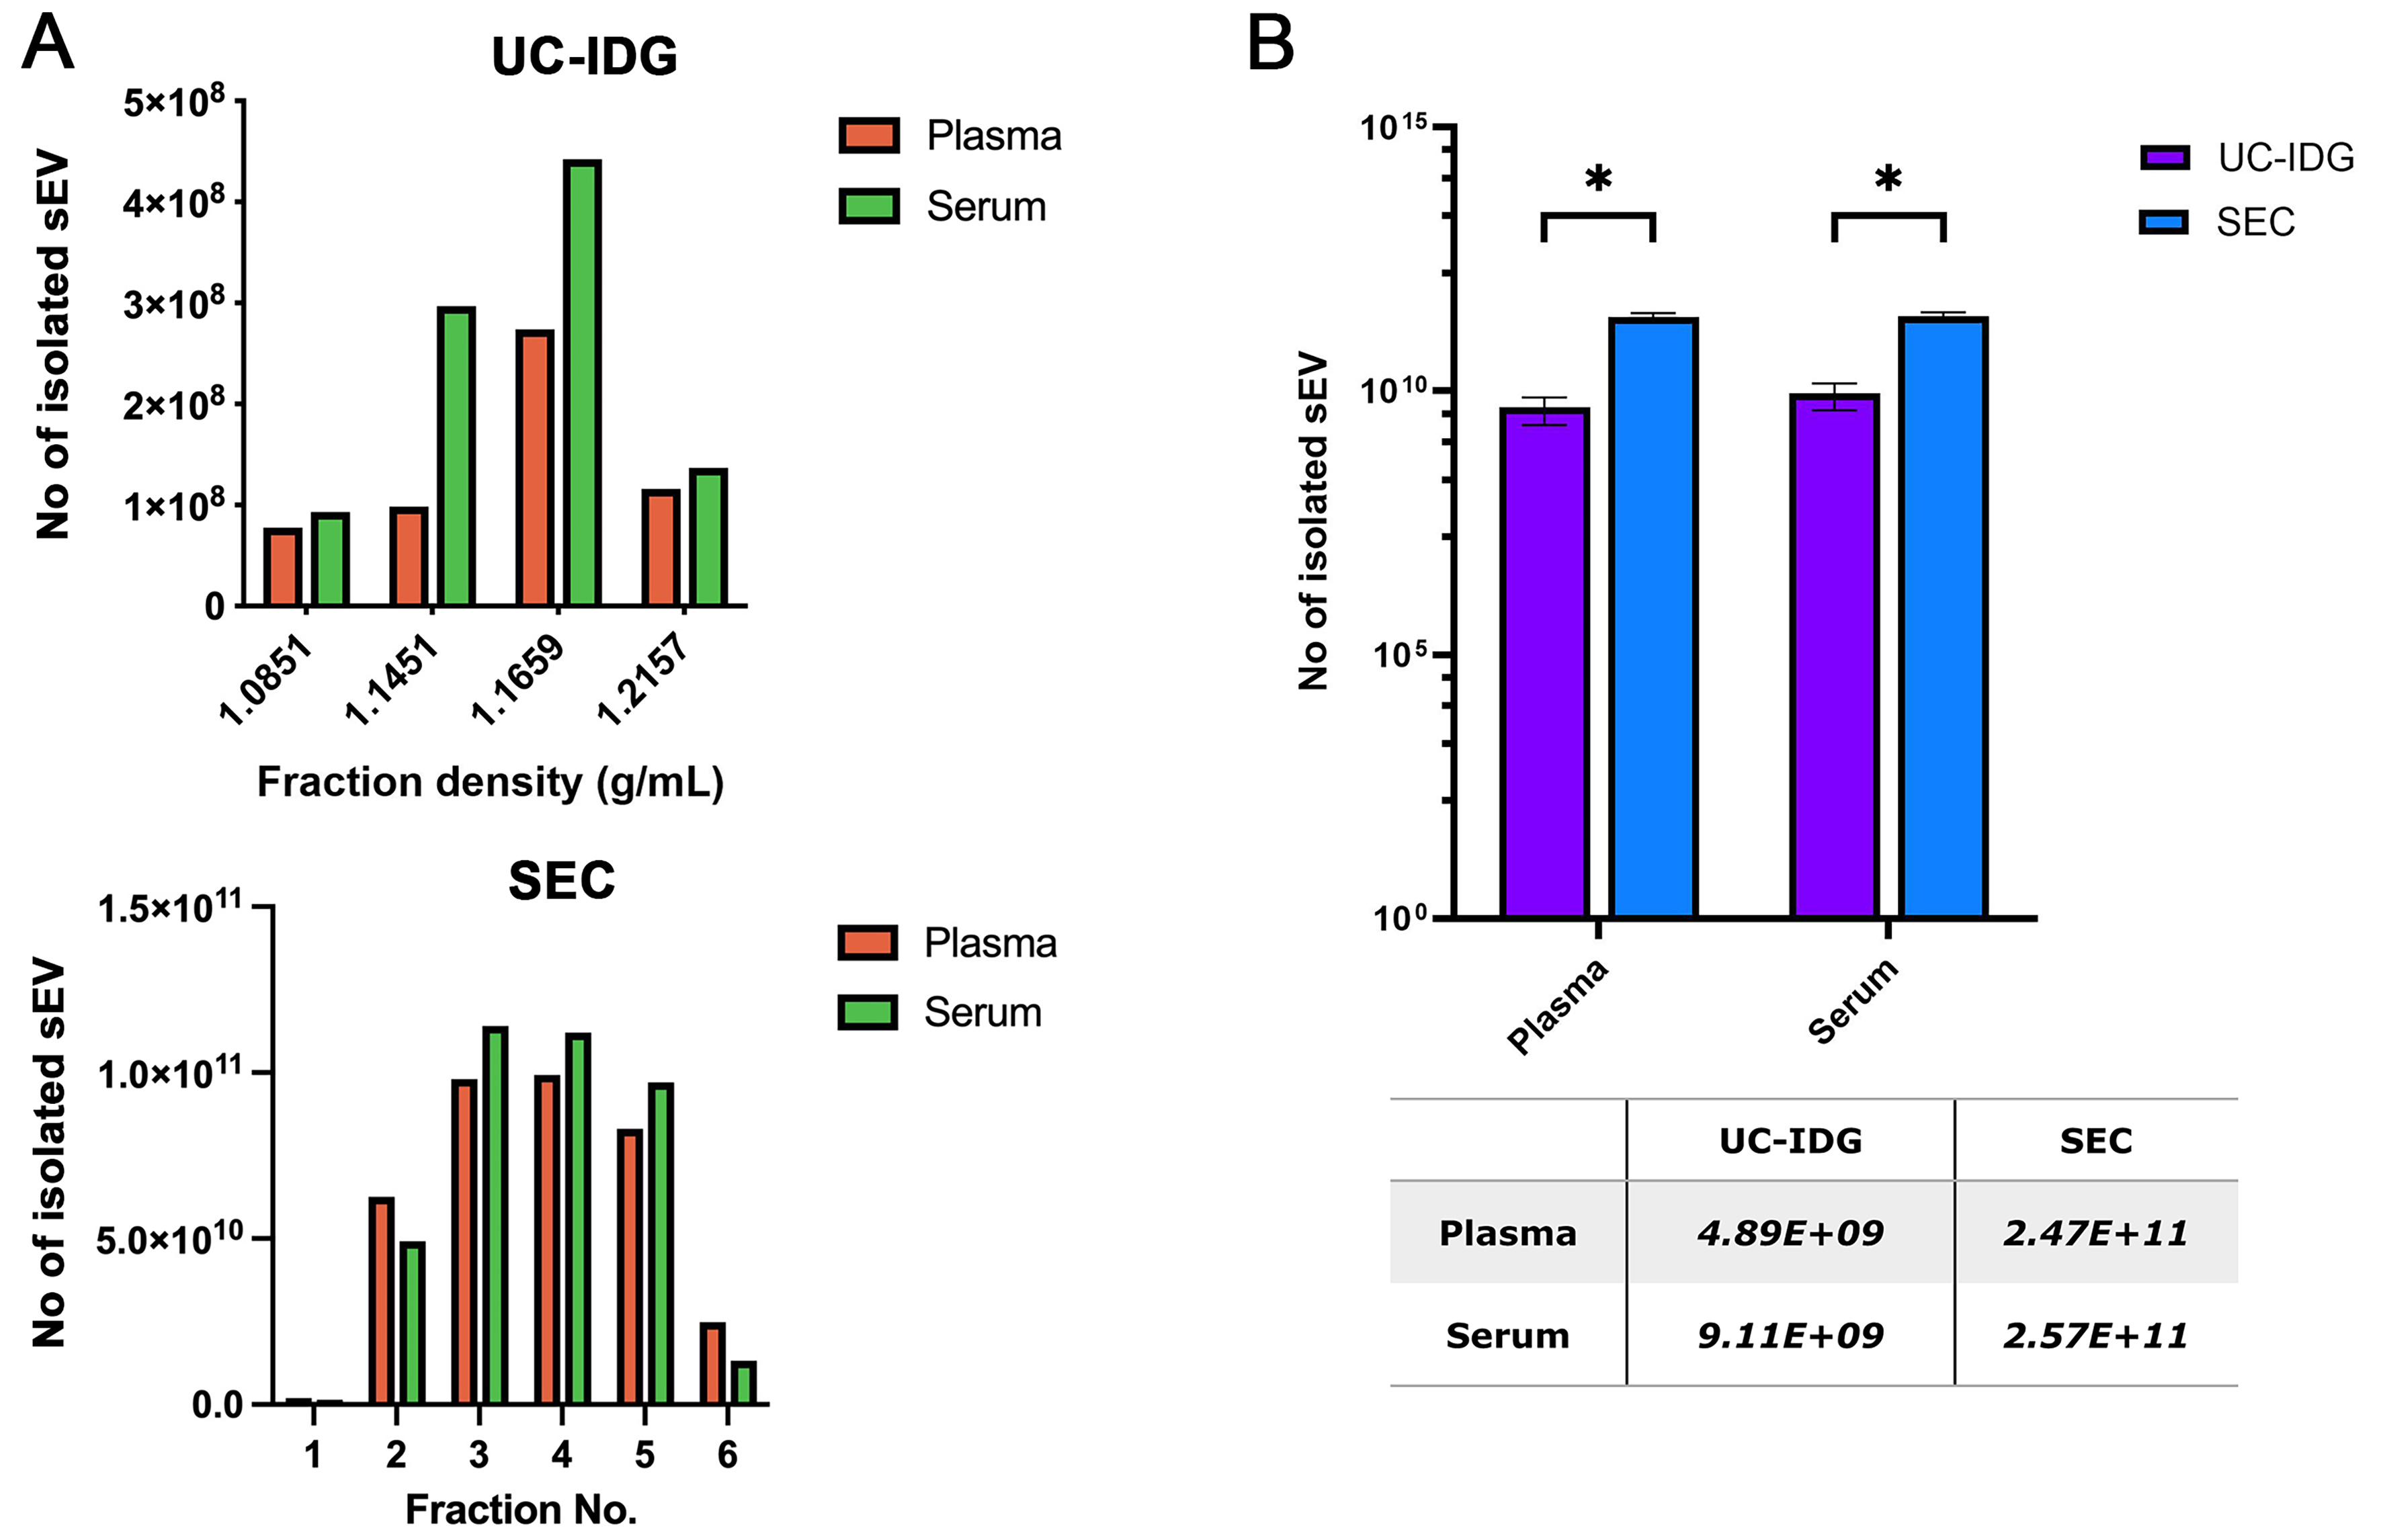
Figure 2. Isolation yields by nanoparticles tracking analysis. (A) Particle concentration analyzed by NTA of UC-IDG fractions (5-8) and SEC fractions. The number of counted particles in pooled fractions is represented and compared in (B). Bars are on a logarithmic scale. Single values are reported in the underlying table. Data presented as mean ± SEM; n (independent biological replicates) = 3. *P < 0.05. UC-IDG: Ultracentrifugation followed by iodixanol density gradient; SEC: size exclusion chromatography; NTA: nanoparticle tracking analysis; SEM: standard error of mean.


