


fig6
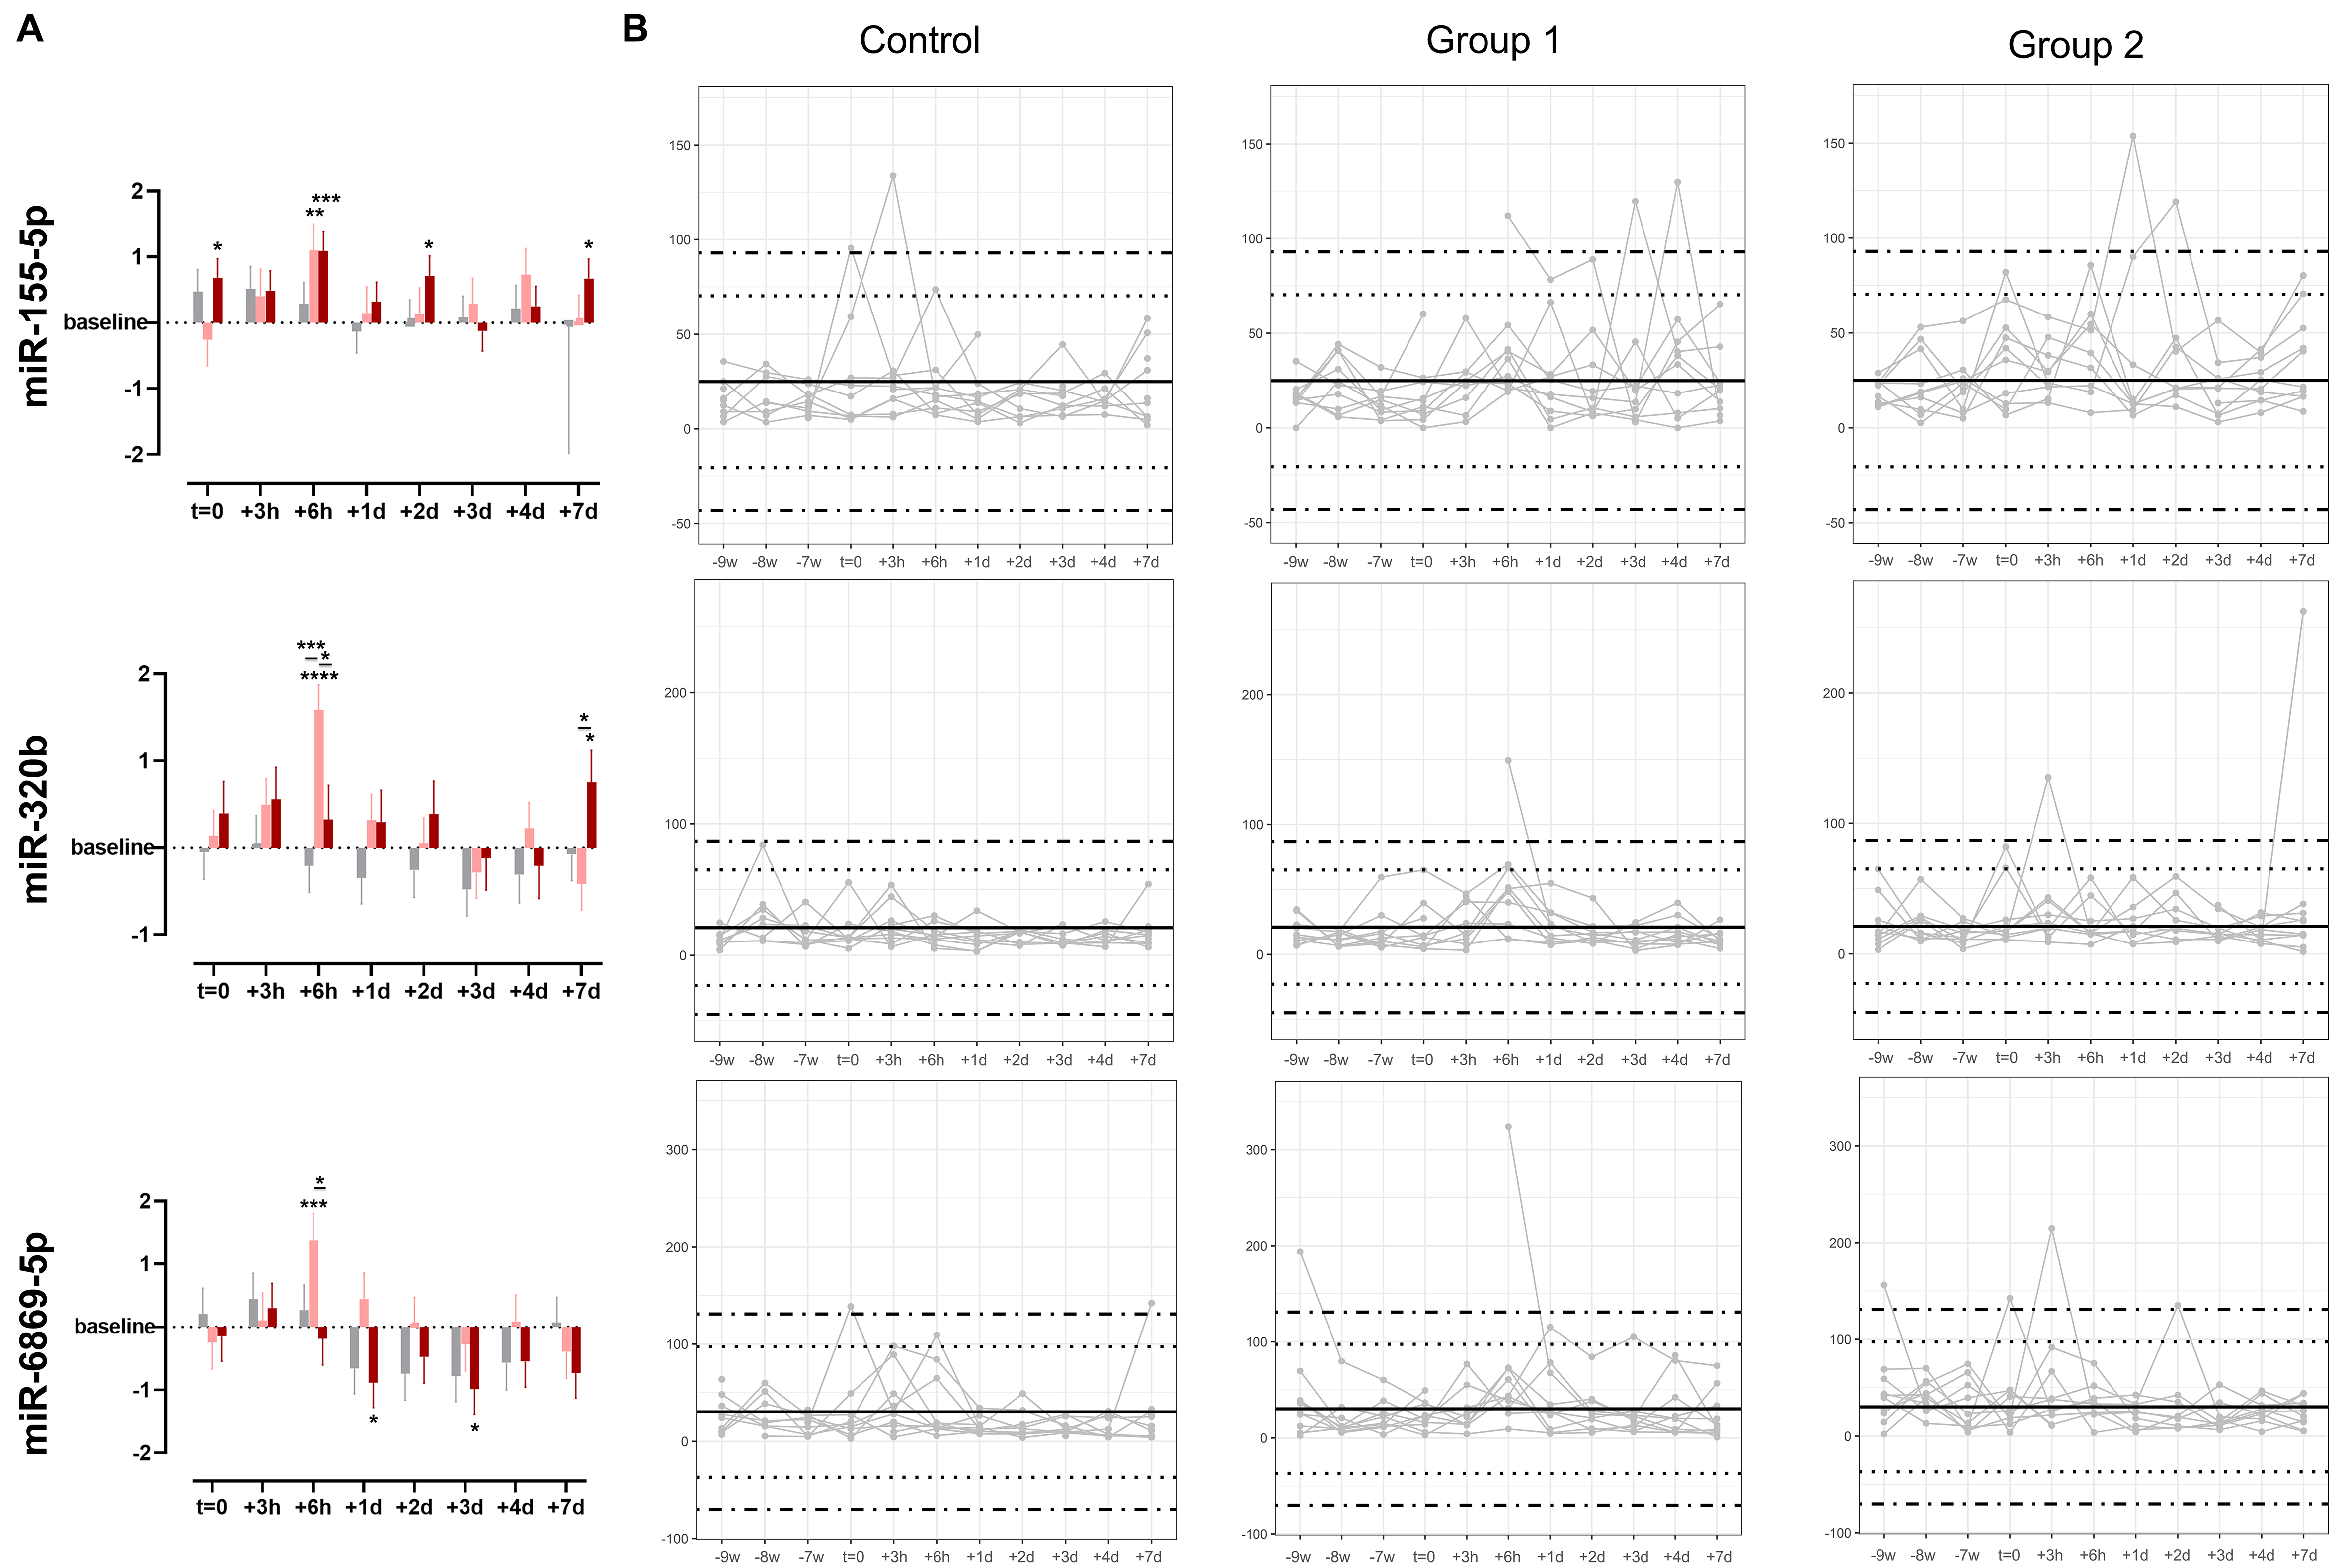
Figure 6. (A) Time-point specific differences in expression levels of selected miRNAs (miR-155-5p, miR-320b, and miR-6869-5p) given as log2FC. Data are shown as mean ± SE. Asterisks indicate significant differences in expression levels compared to baseline or treatment and control groups with adjusted P-values (two-way ANOVA: *P < 0.05; **P < 0.01; ***P < 0.001; and ****P < 0.0001), n = 10 per group. Gray color indicates control group, light red indicates Group 1, and dark red indicates Group 2; (B) Individual longitudinal profiles of regulated miRNAs. Data are shown as DESeq2-normalized reads per subject with n = 10 per group. Dotted lines depict z-scores of |2| and dot-dashed lines z-scores of |3|. ANOVA: Analysis of variance; miRNA: microRNA; log2FC: log2 fold change; SE: standard error; DESeq2: a normalization and differential expression analysis tool.


