


fig5
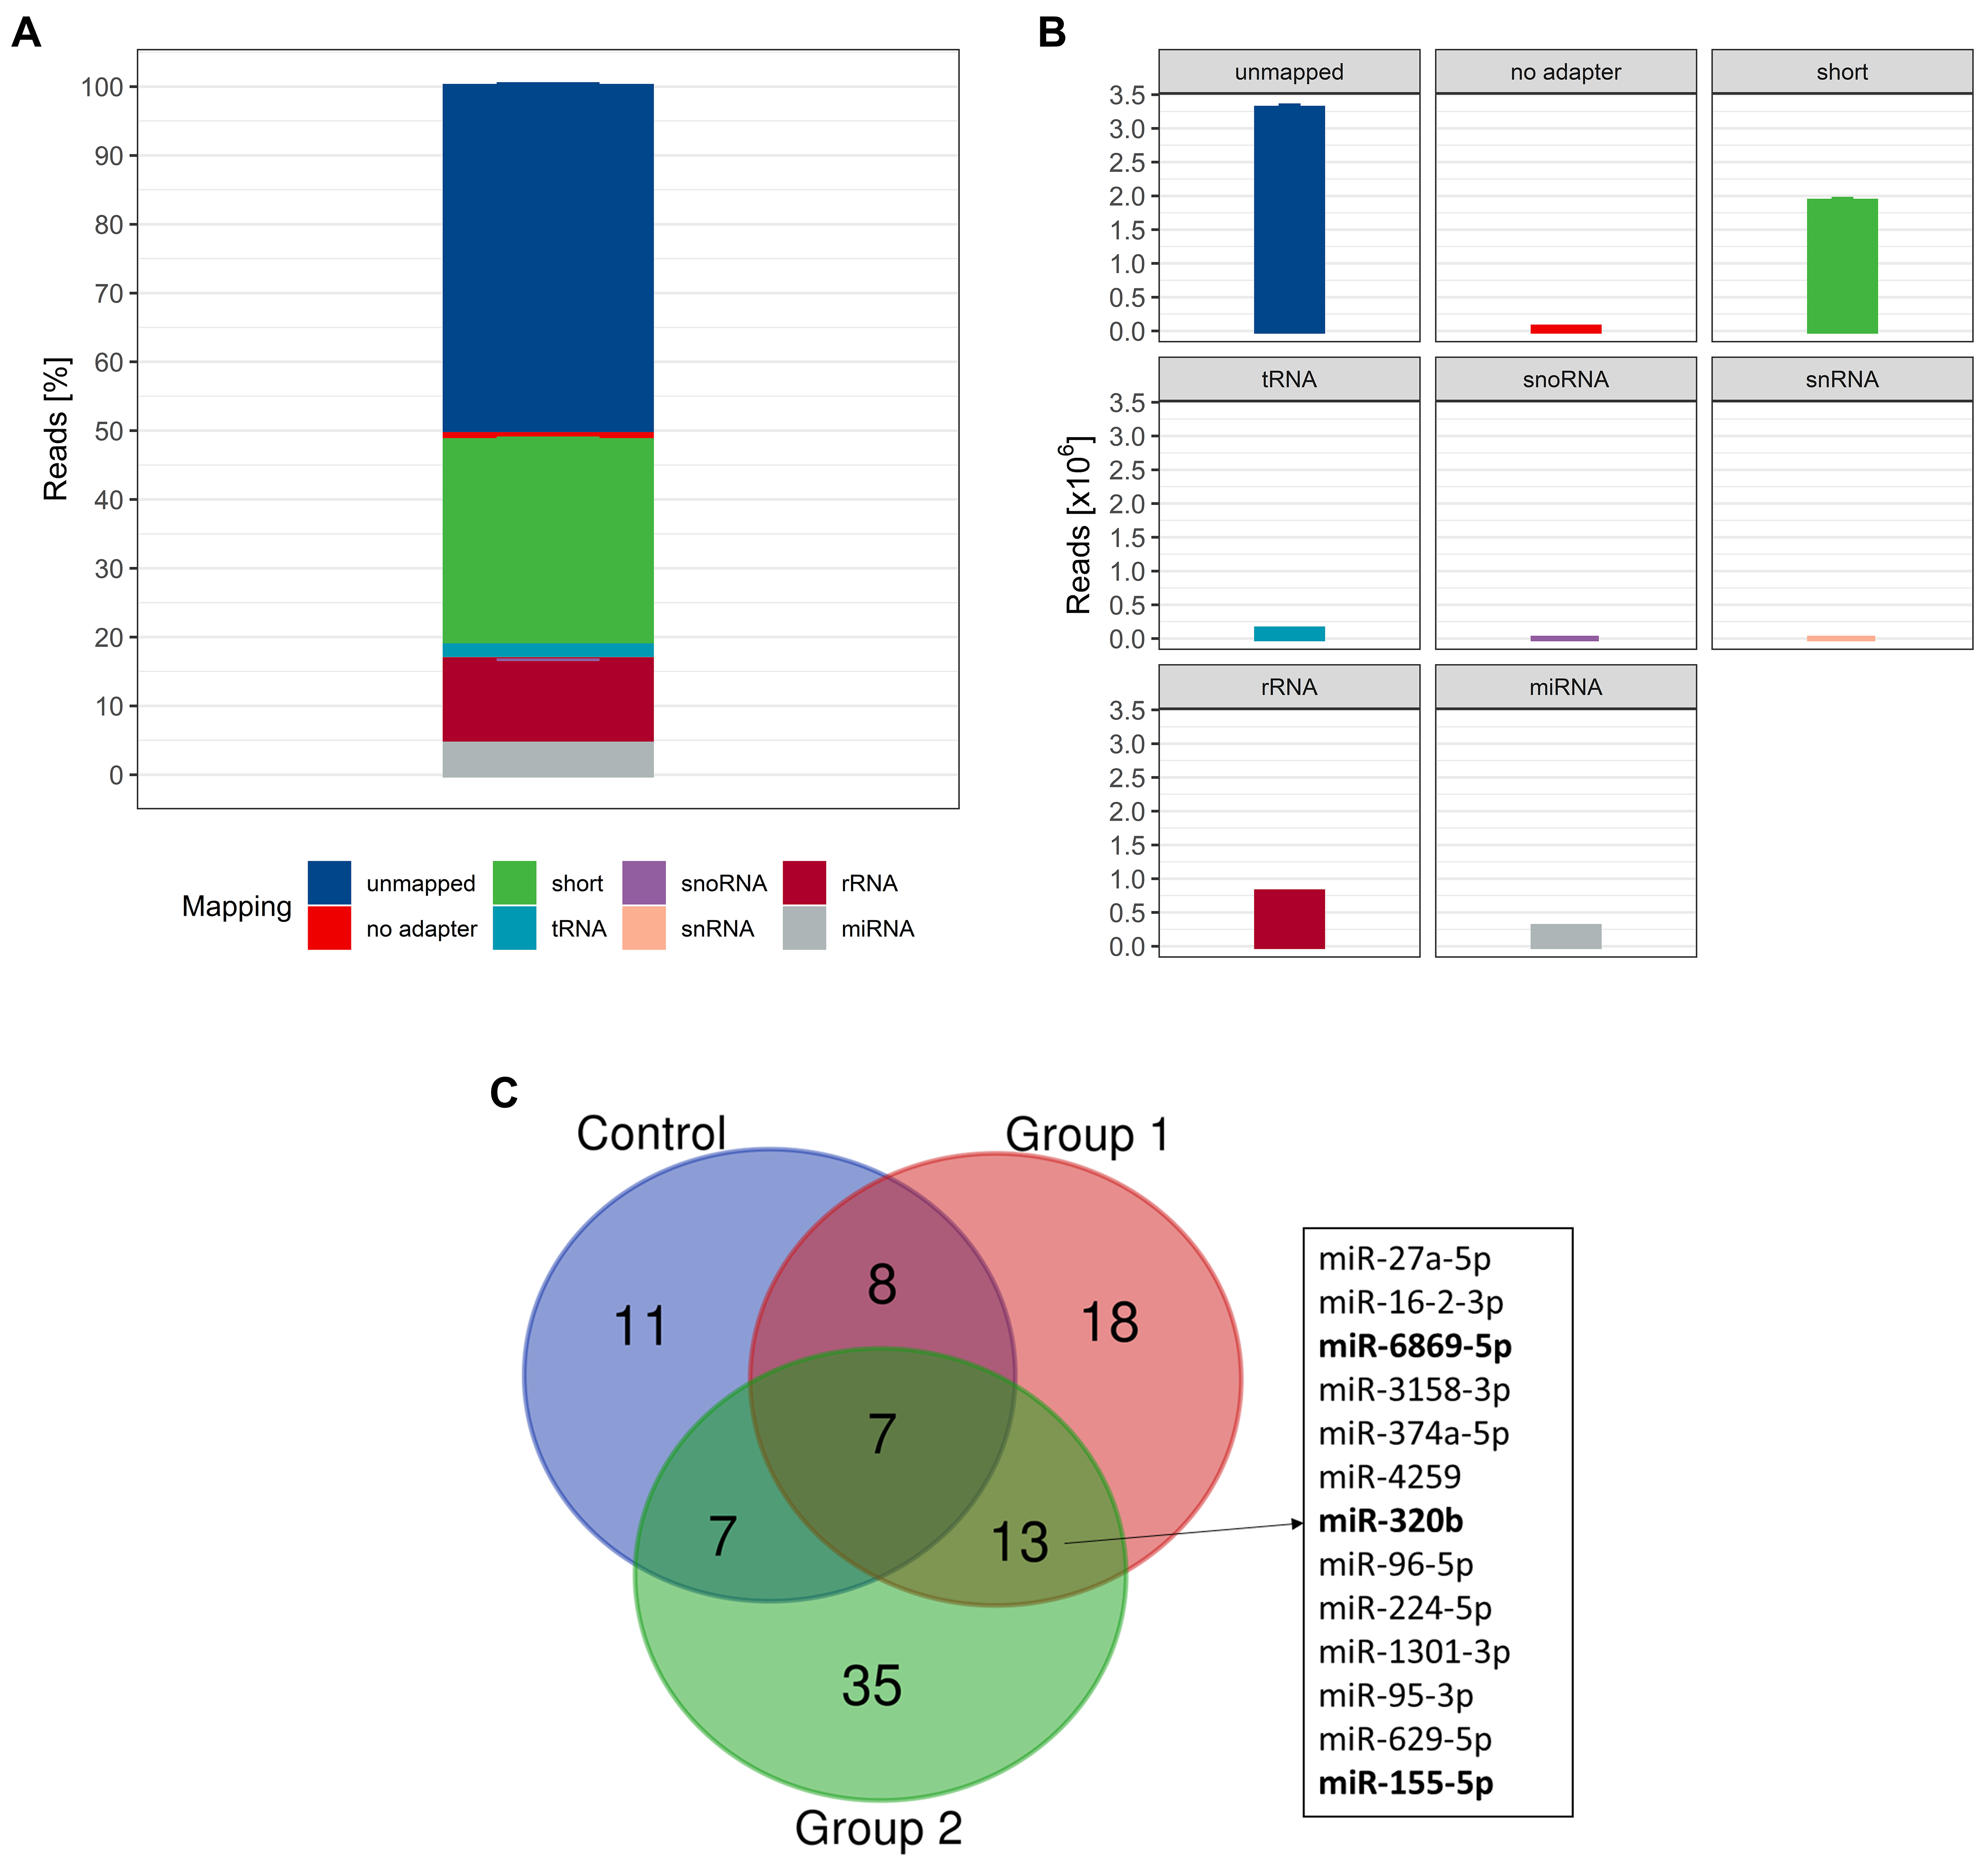
Figure 5. (A) Relative and (B) absolute mapping distribution. Data are shown as mean ± SD (n = 321); (C) Overlap of differentially expressed miRNAs; compared to intra-group baseline with |FC| > 1.5 and P < 0.05. Bold miRNAs were detected with DESeq2-normalized read counts > 20 (n = 320). SD: Standard deviation; miRNA: microRNA; FC: fold change; DESeq2: a normalization and differential expression analysis tool.


