fig4

Impact of autologous blood transfusions on surface marker and microRNA profiles of urinary extracellular vesicles

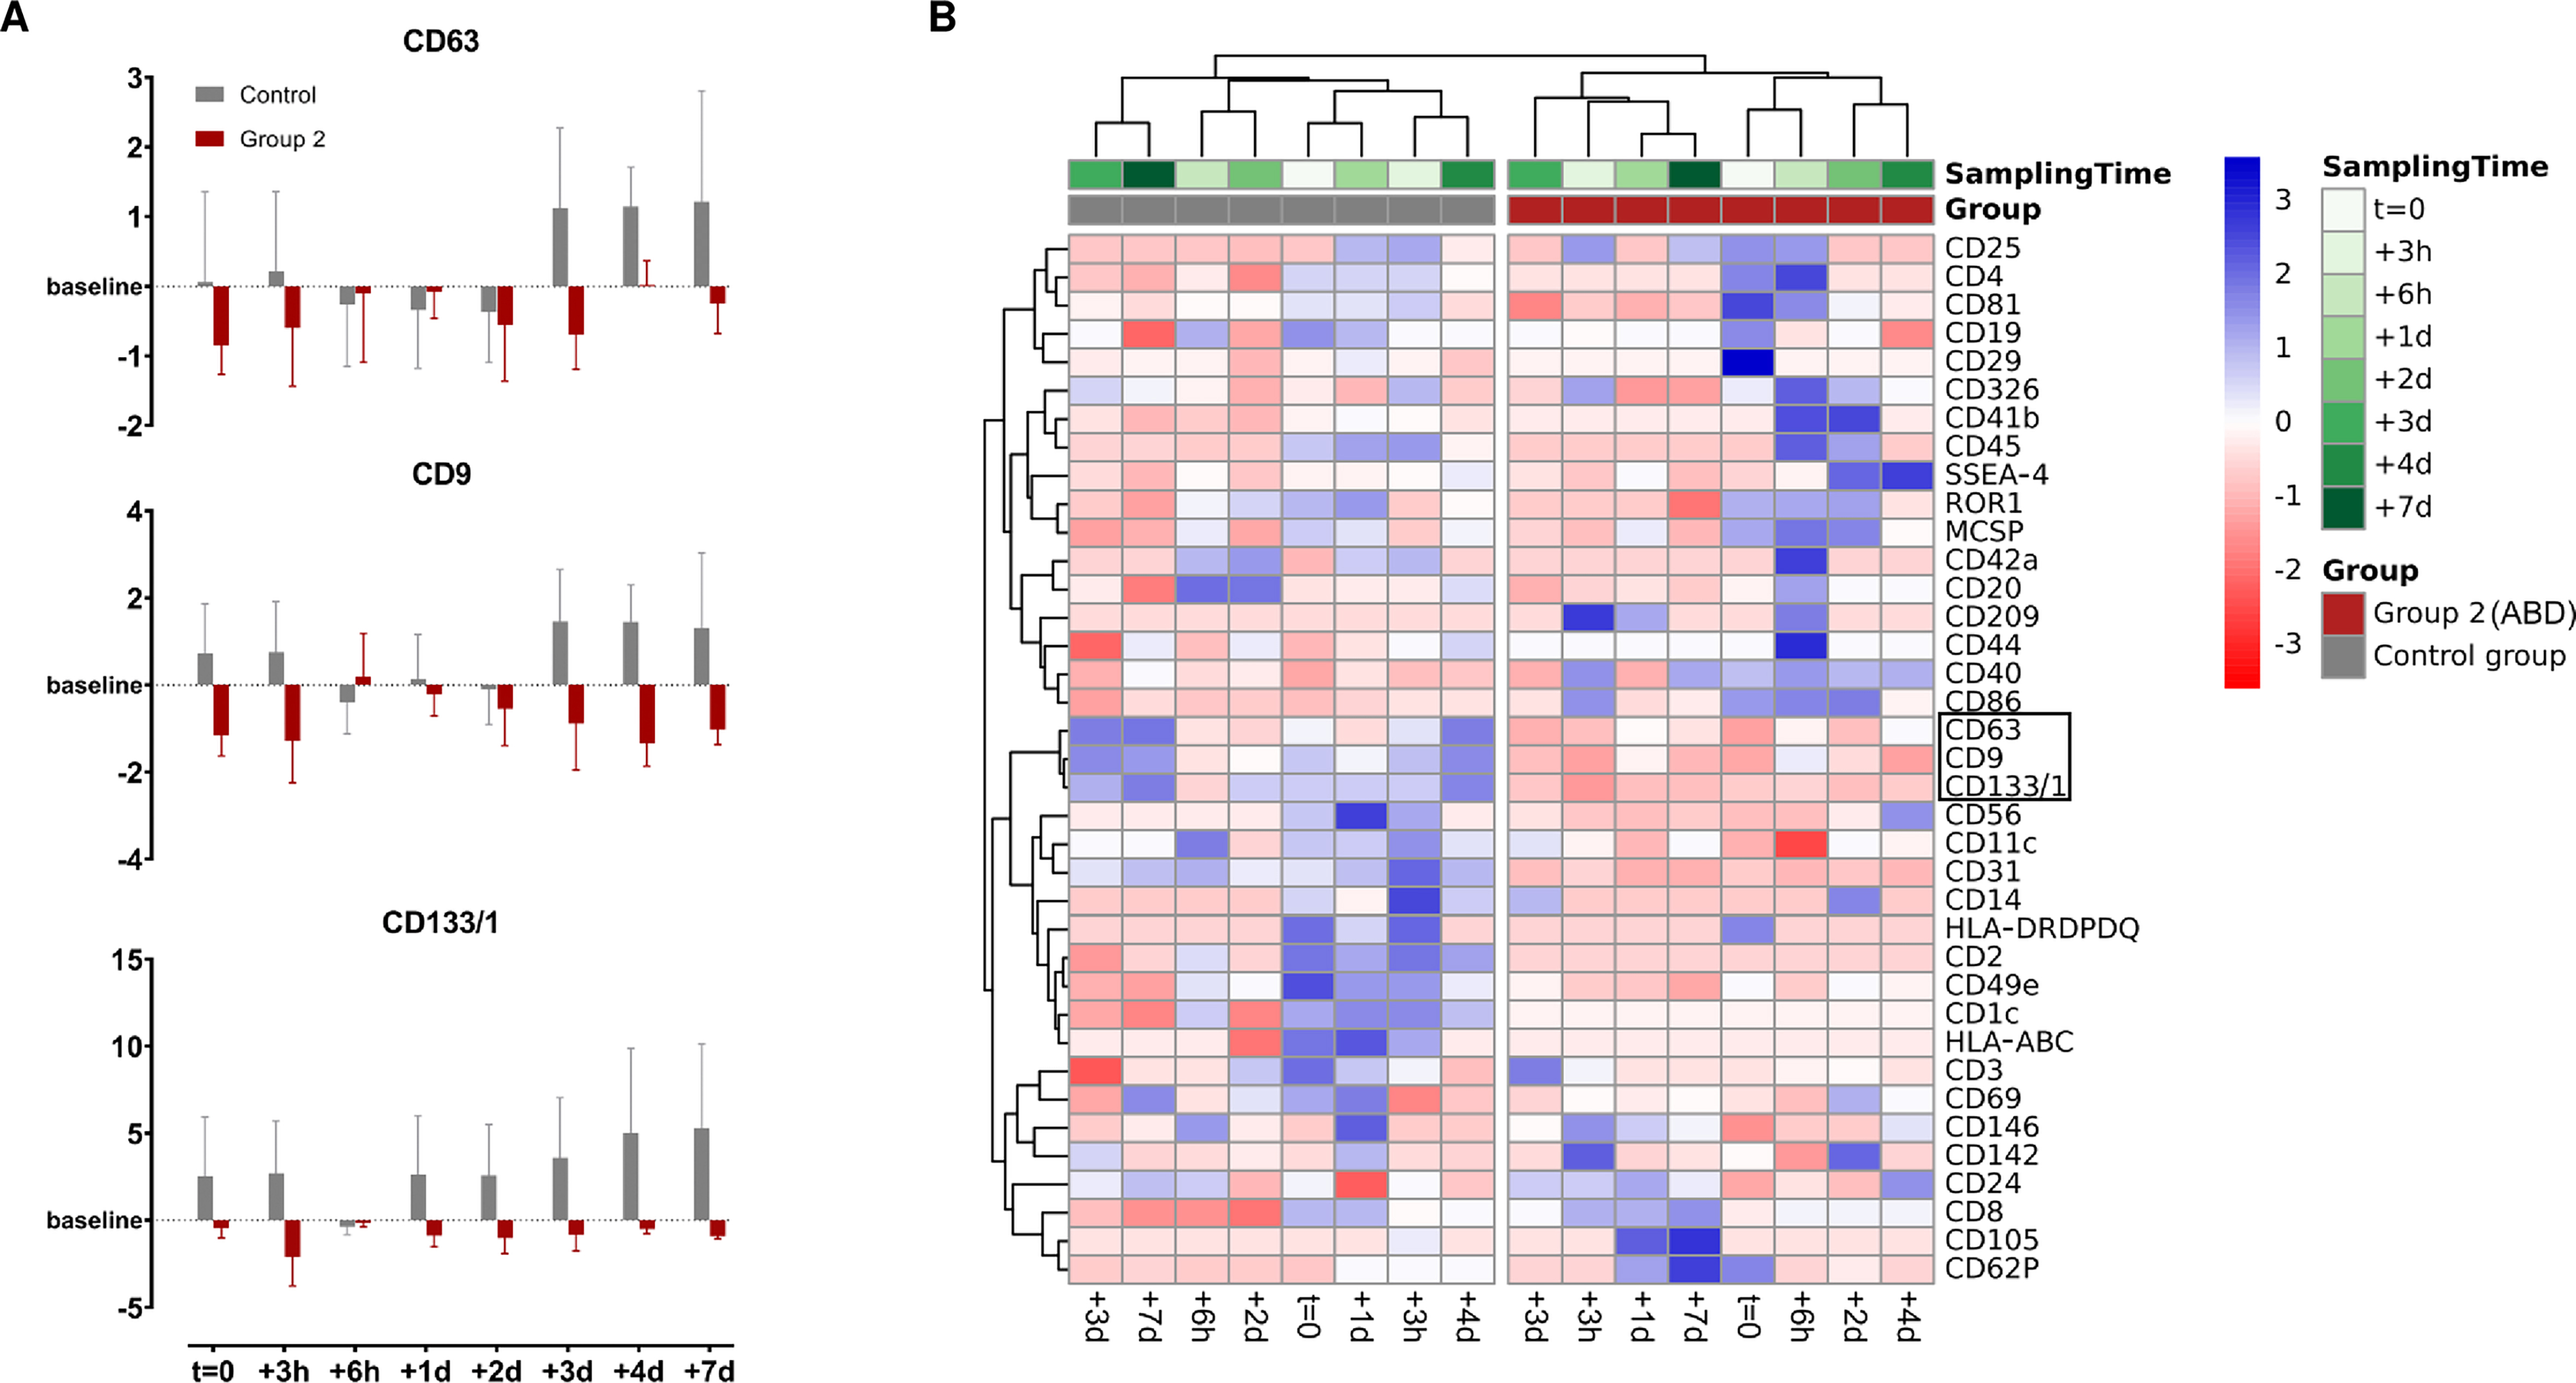
Figure 4. Visualization of the discriminative ability of surface marker dynamics. (A) Log2FC of CD63, CD9 and CD133/1 illustrated as mean ± standard error; (B) Heatmap clustering analysis of row-scaled log2FC were examined using Pearson correlation. (Control group, n = 3; Group 2, n = 4).

Extracellular Vesicles and Circulating Nucleic Acids
ISSN 2767-6641 (Online)
Follow Us

Portico

All published articles are preserved here permanently:

https://www.portico.org/publishers/oae/

Portico

All published articles are preserved here permanently:

https://www.portico.org/publishers/oae/