


fig3
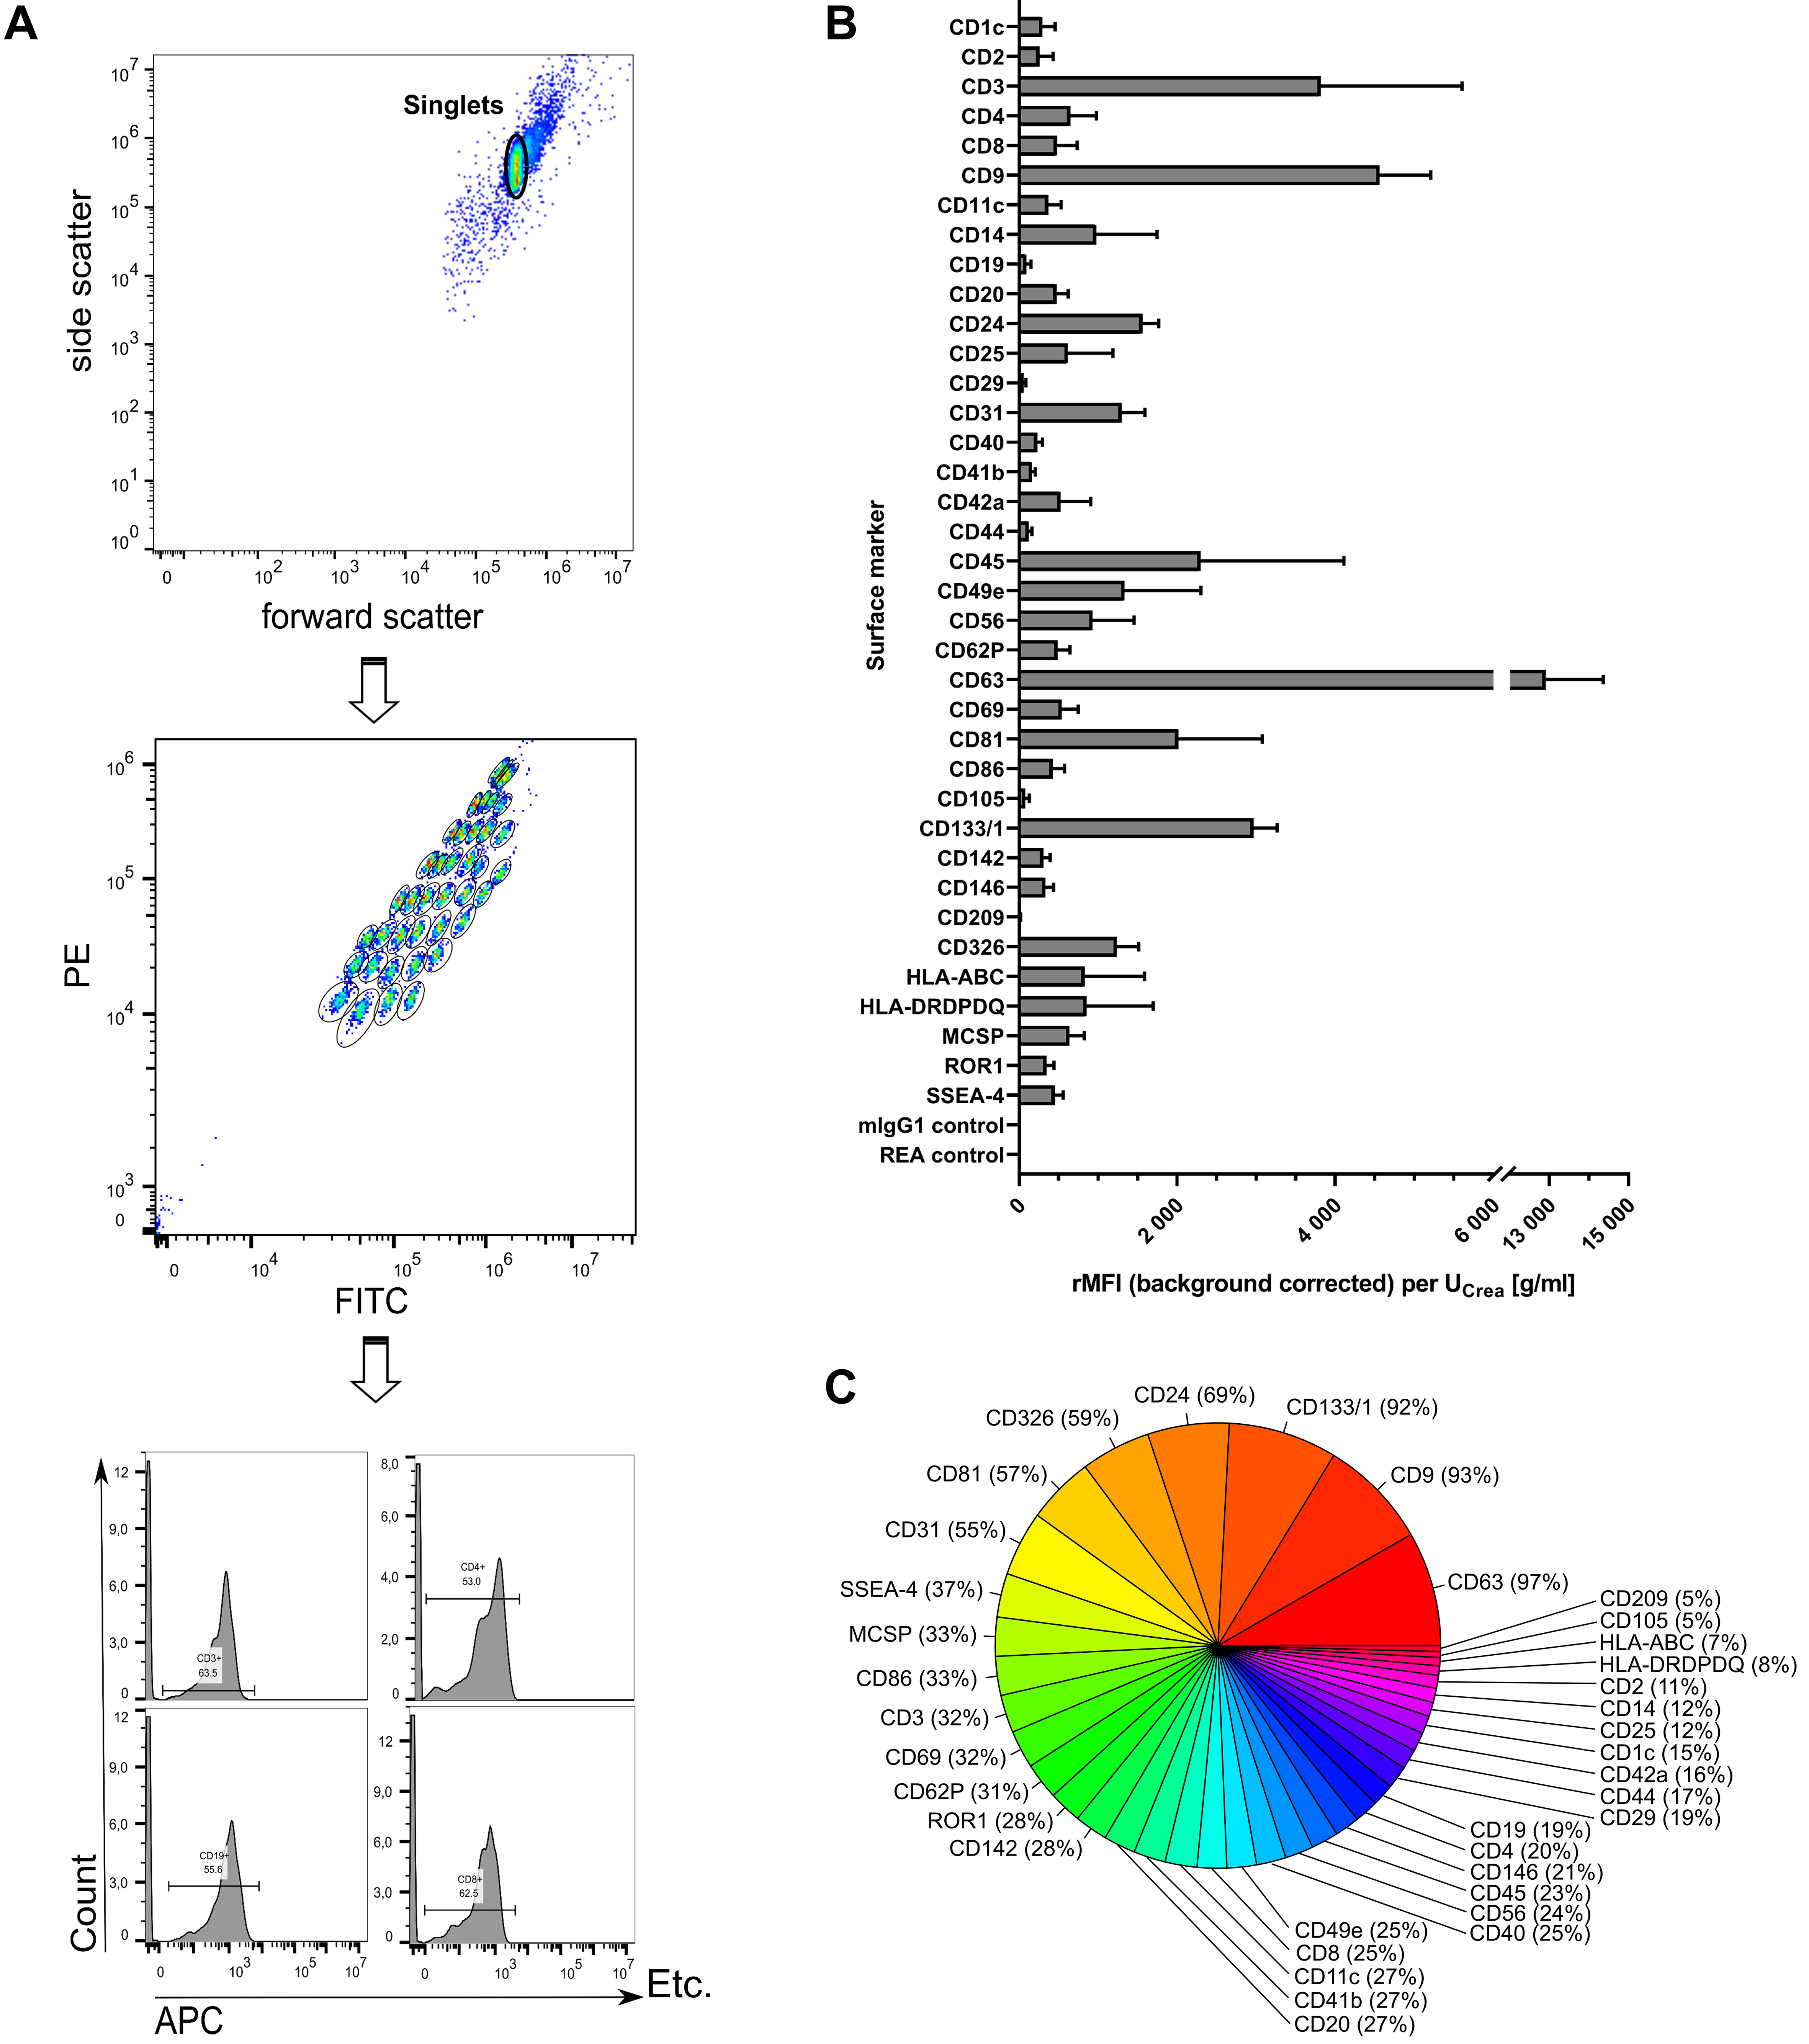
Figure 3. Multiplexed phenotyping of uEV surface markers. (A) Exemplary sample showing feature selection by including only the singlet population, gating on the different bead populations, and counting only APC-positive signals for each single bead population; (B) Overall surface marker distribution displayed as the rMFI after background correction and normalization to urinary creatinine levels (UCrea) displayed as mean ± standard error [overall n = 7; including control (n = 3) and group 2 (n = 4) at 11 time points each]; (C) Surface marker abundance illustrated as percentage of samples in which the respective marker was detected. uEVs: Urinary extracellular vesicles; rMFI: relative median APC fluorescence intensities; APC: allophycocyanin; UCrea: urinary creatinine.


