


fig2
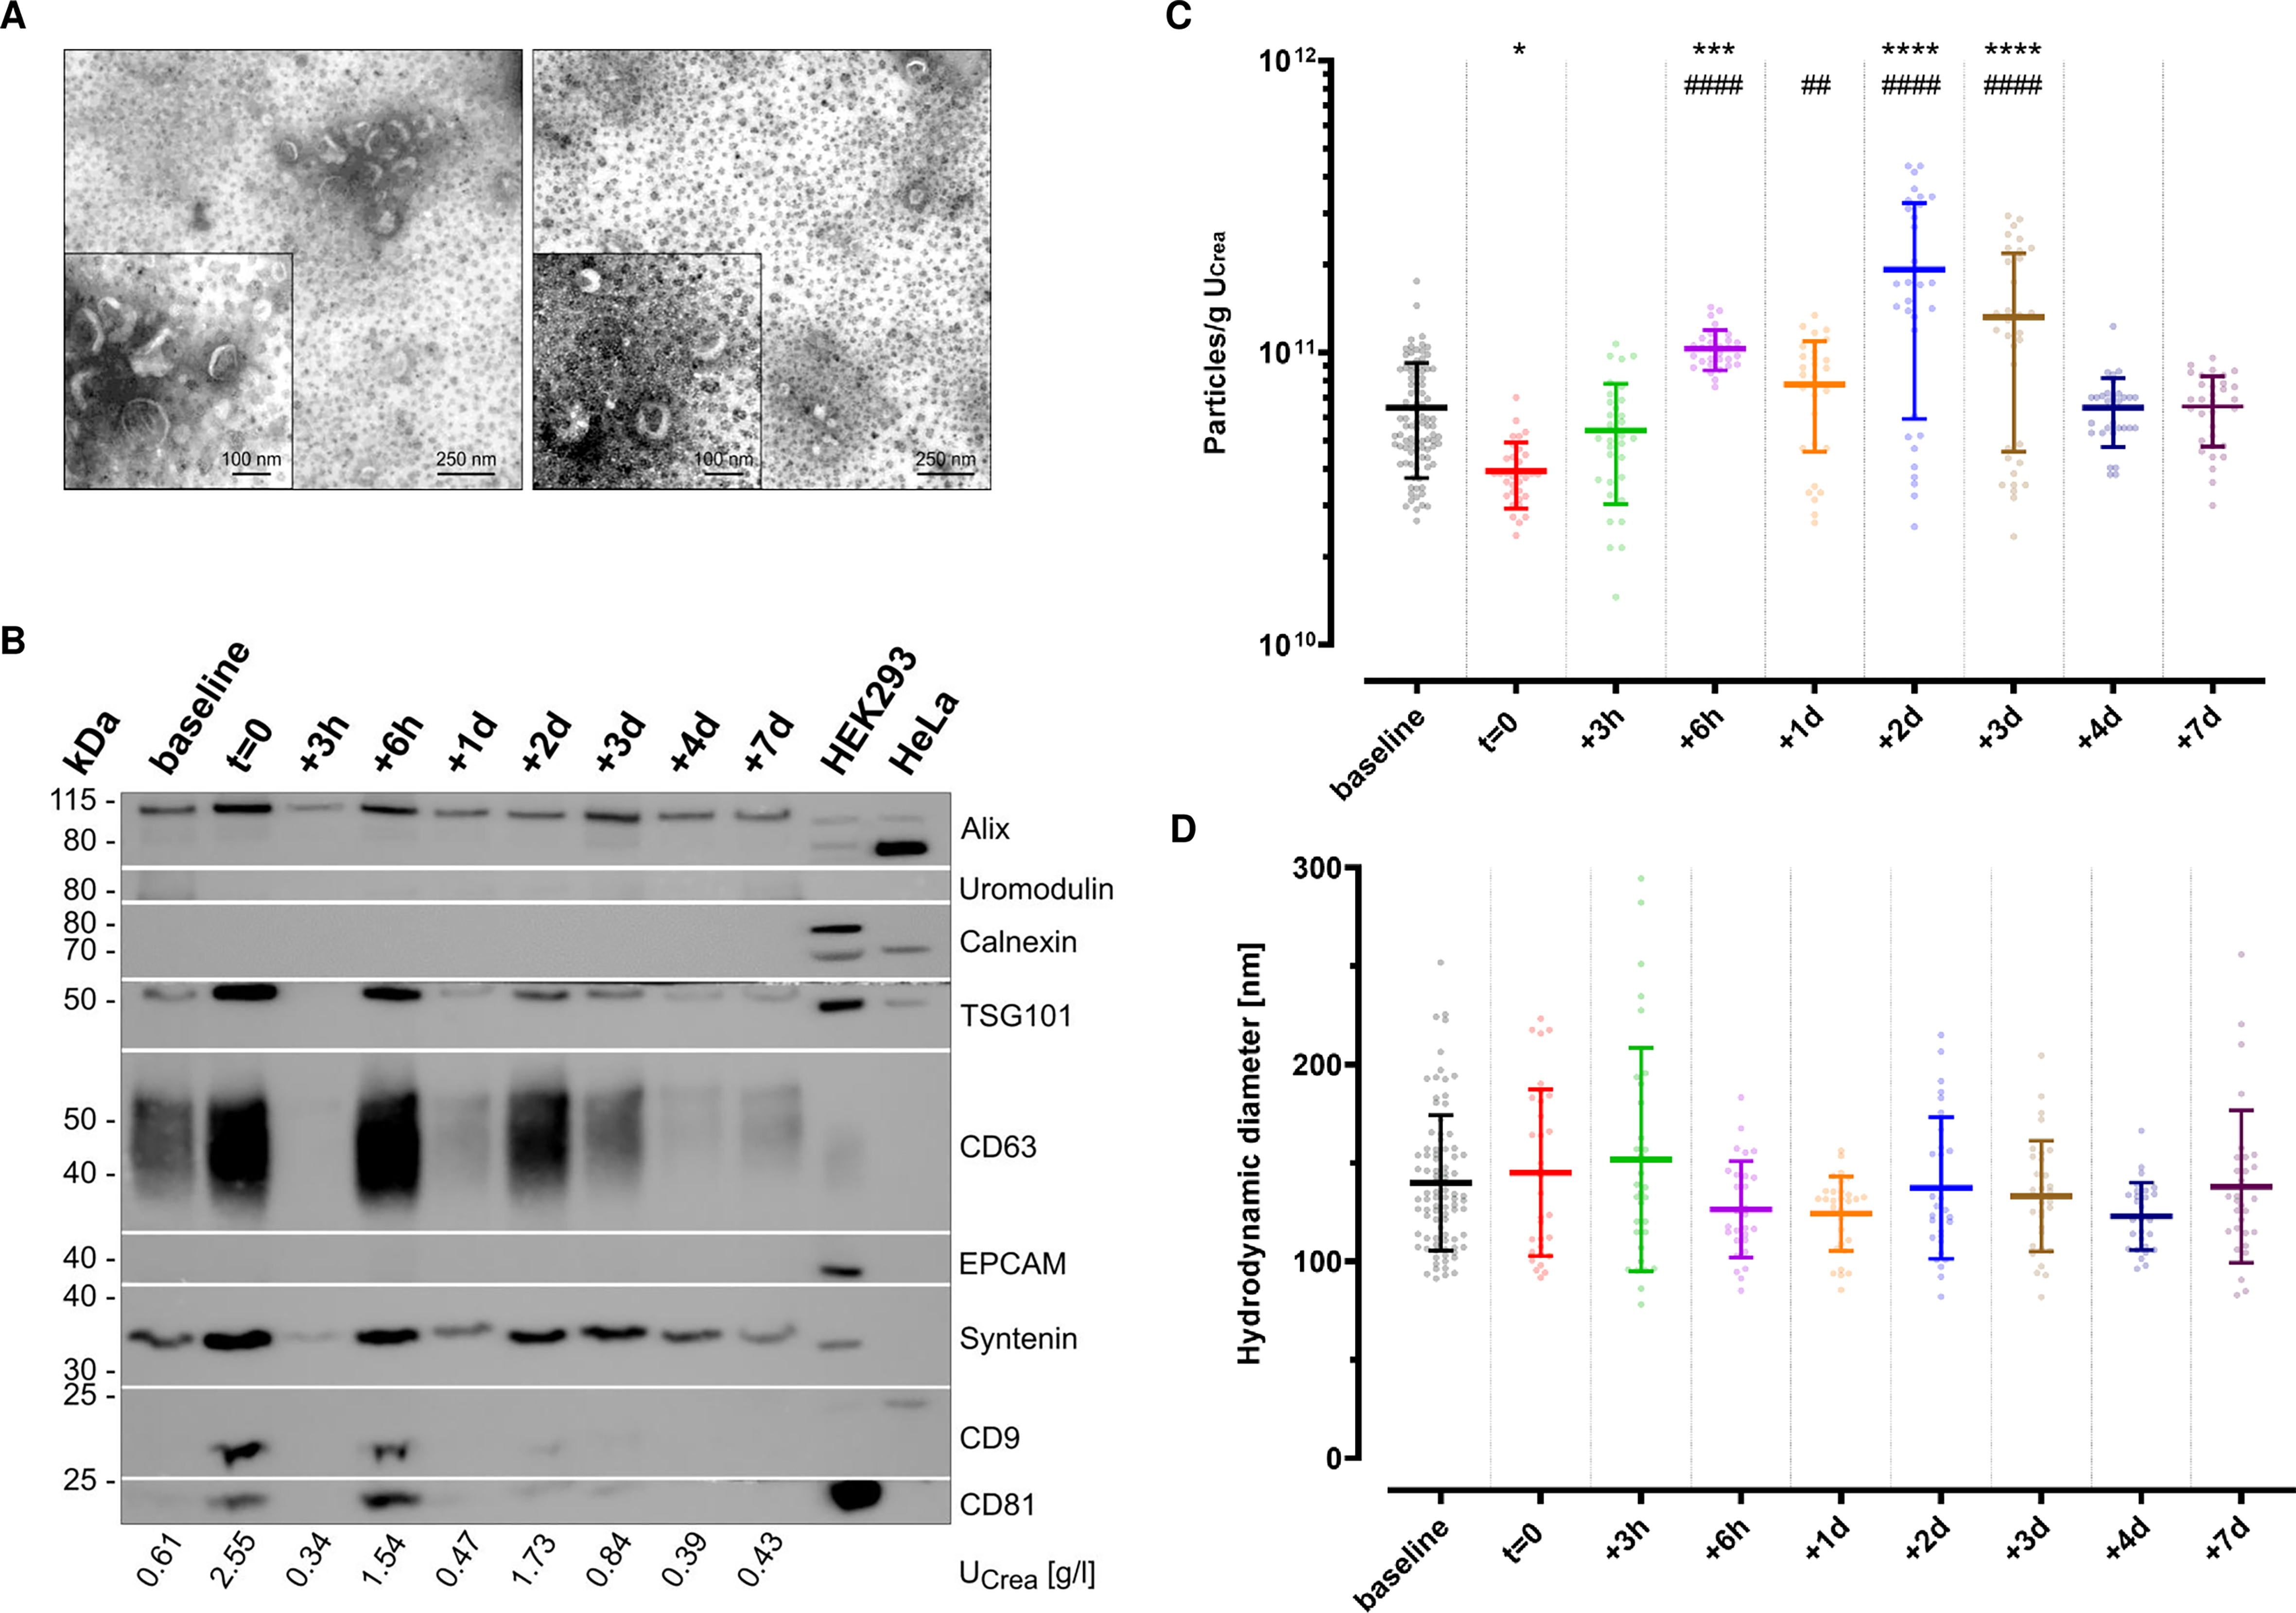
Figure 2. Characterization of uEVs separated by immunoaffinity. (A) TEM images of two representative samples illustrate desiccated vesicles (wide field: scale bar 250 nm; close-up: scale bar 100 nm). The omnipresent black dots indicate magnetic beads carried over from immunoaffinity-based enrichment. Brightness was adjusted for each other for better visibility using IrfanView software; (B) Western blot analysis of uEV-enriched eluates originating from one representative individual with different urinary dilutions, as indicated by the corresponding creatinine levels (UCrea). Images were cropped to the corresponding protein marker size range for a better overview. Baseline summarizes -9 w, -8 w, -7 w; (C) Fluorescence NTA (n = 3 of Group 2 with eight to 11 technical replicates each; baseline includes -9 w, -8 w, -7 w; mean ± SD; *one-way ANOVA: adjust P < 0.05, ***P < 0.001, ****P < 0.0001 vs. baseline, adjusted ##P < 0.01, ####P < 0.0001 vs. t = 0) indicating particle concentration, normalized to input volumes and urinary creatinine levels (UCrea); and (D) hydrodynamic particle diameters; mean ± SD. ANOVA: Analysis of variance; uEV: urinary extracellular vesicle; TEM: transmission electron microscopy;


