


fig6
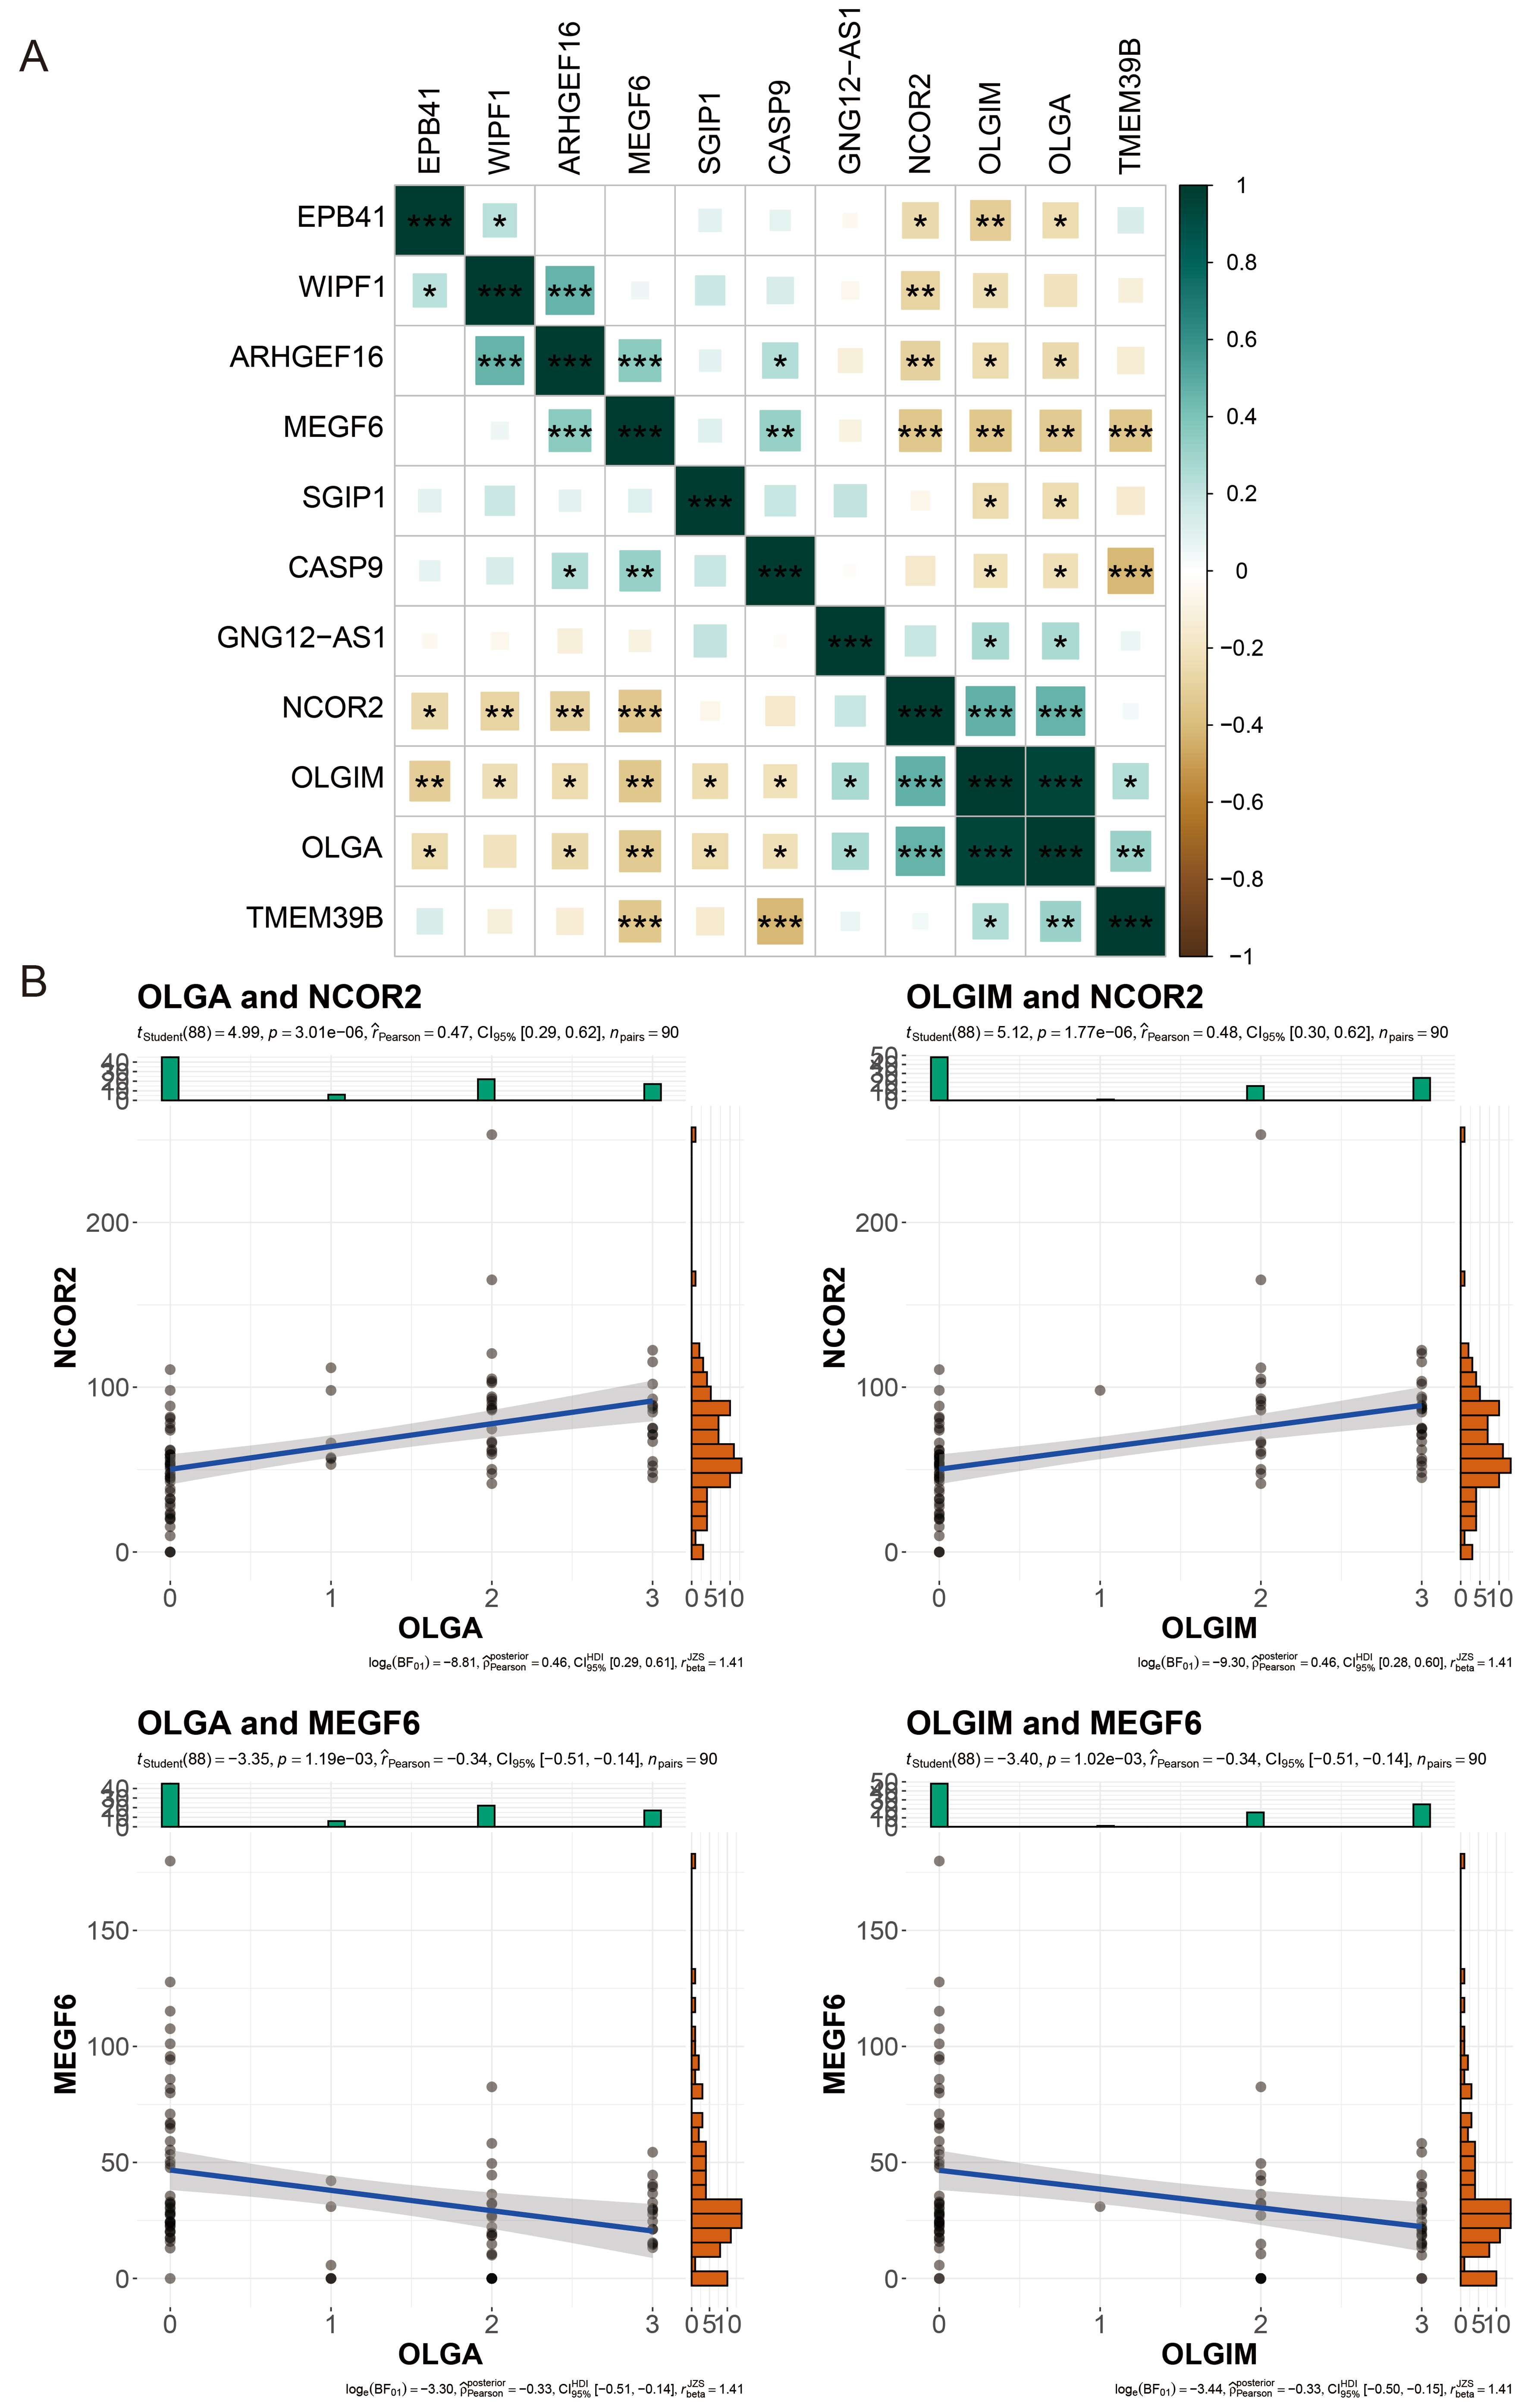
Figure 6. Correlation Analysis of DhMGs with Clinical Indicators. (A) Heatmap of the correlation between different DhMGs and clinical indicators (OLGA and OLGIM); (B) Scatter plots showing the relationships between clinical indicators (OLGA, OLGIM) and the gene expression of DhMGs (NCOR2 and MEGF6) with clinical variables. The y-axis shows the normalized counts of DhMGs per sample, and the x-axis shows the OLGA or OLGIM score. *P < 0.05; **P < 0.01; ***P < 0.001. ns: Not significant (Pearson correlation coefficient test). OLGA: Operative link on gastritis assessment; OLGIM: operative link on gastric intestinal metaplasia assessment; DhMGs: differentially hydroxymethylated genes.


