


fig5
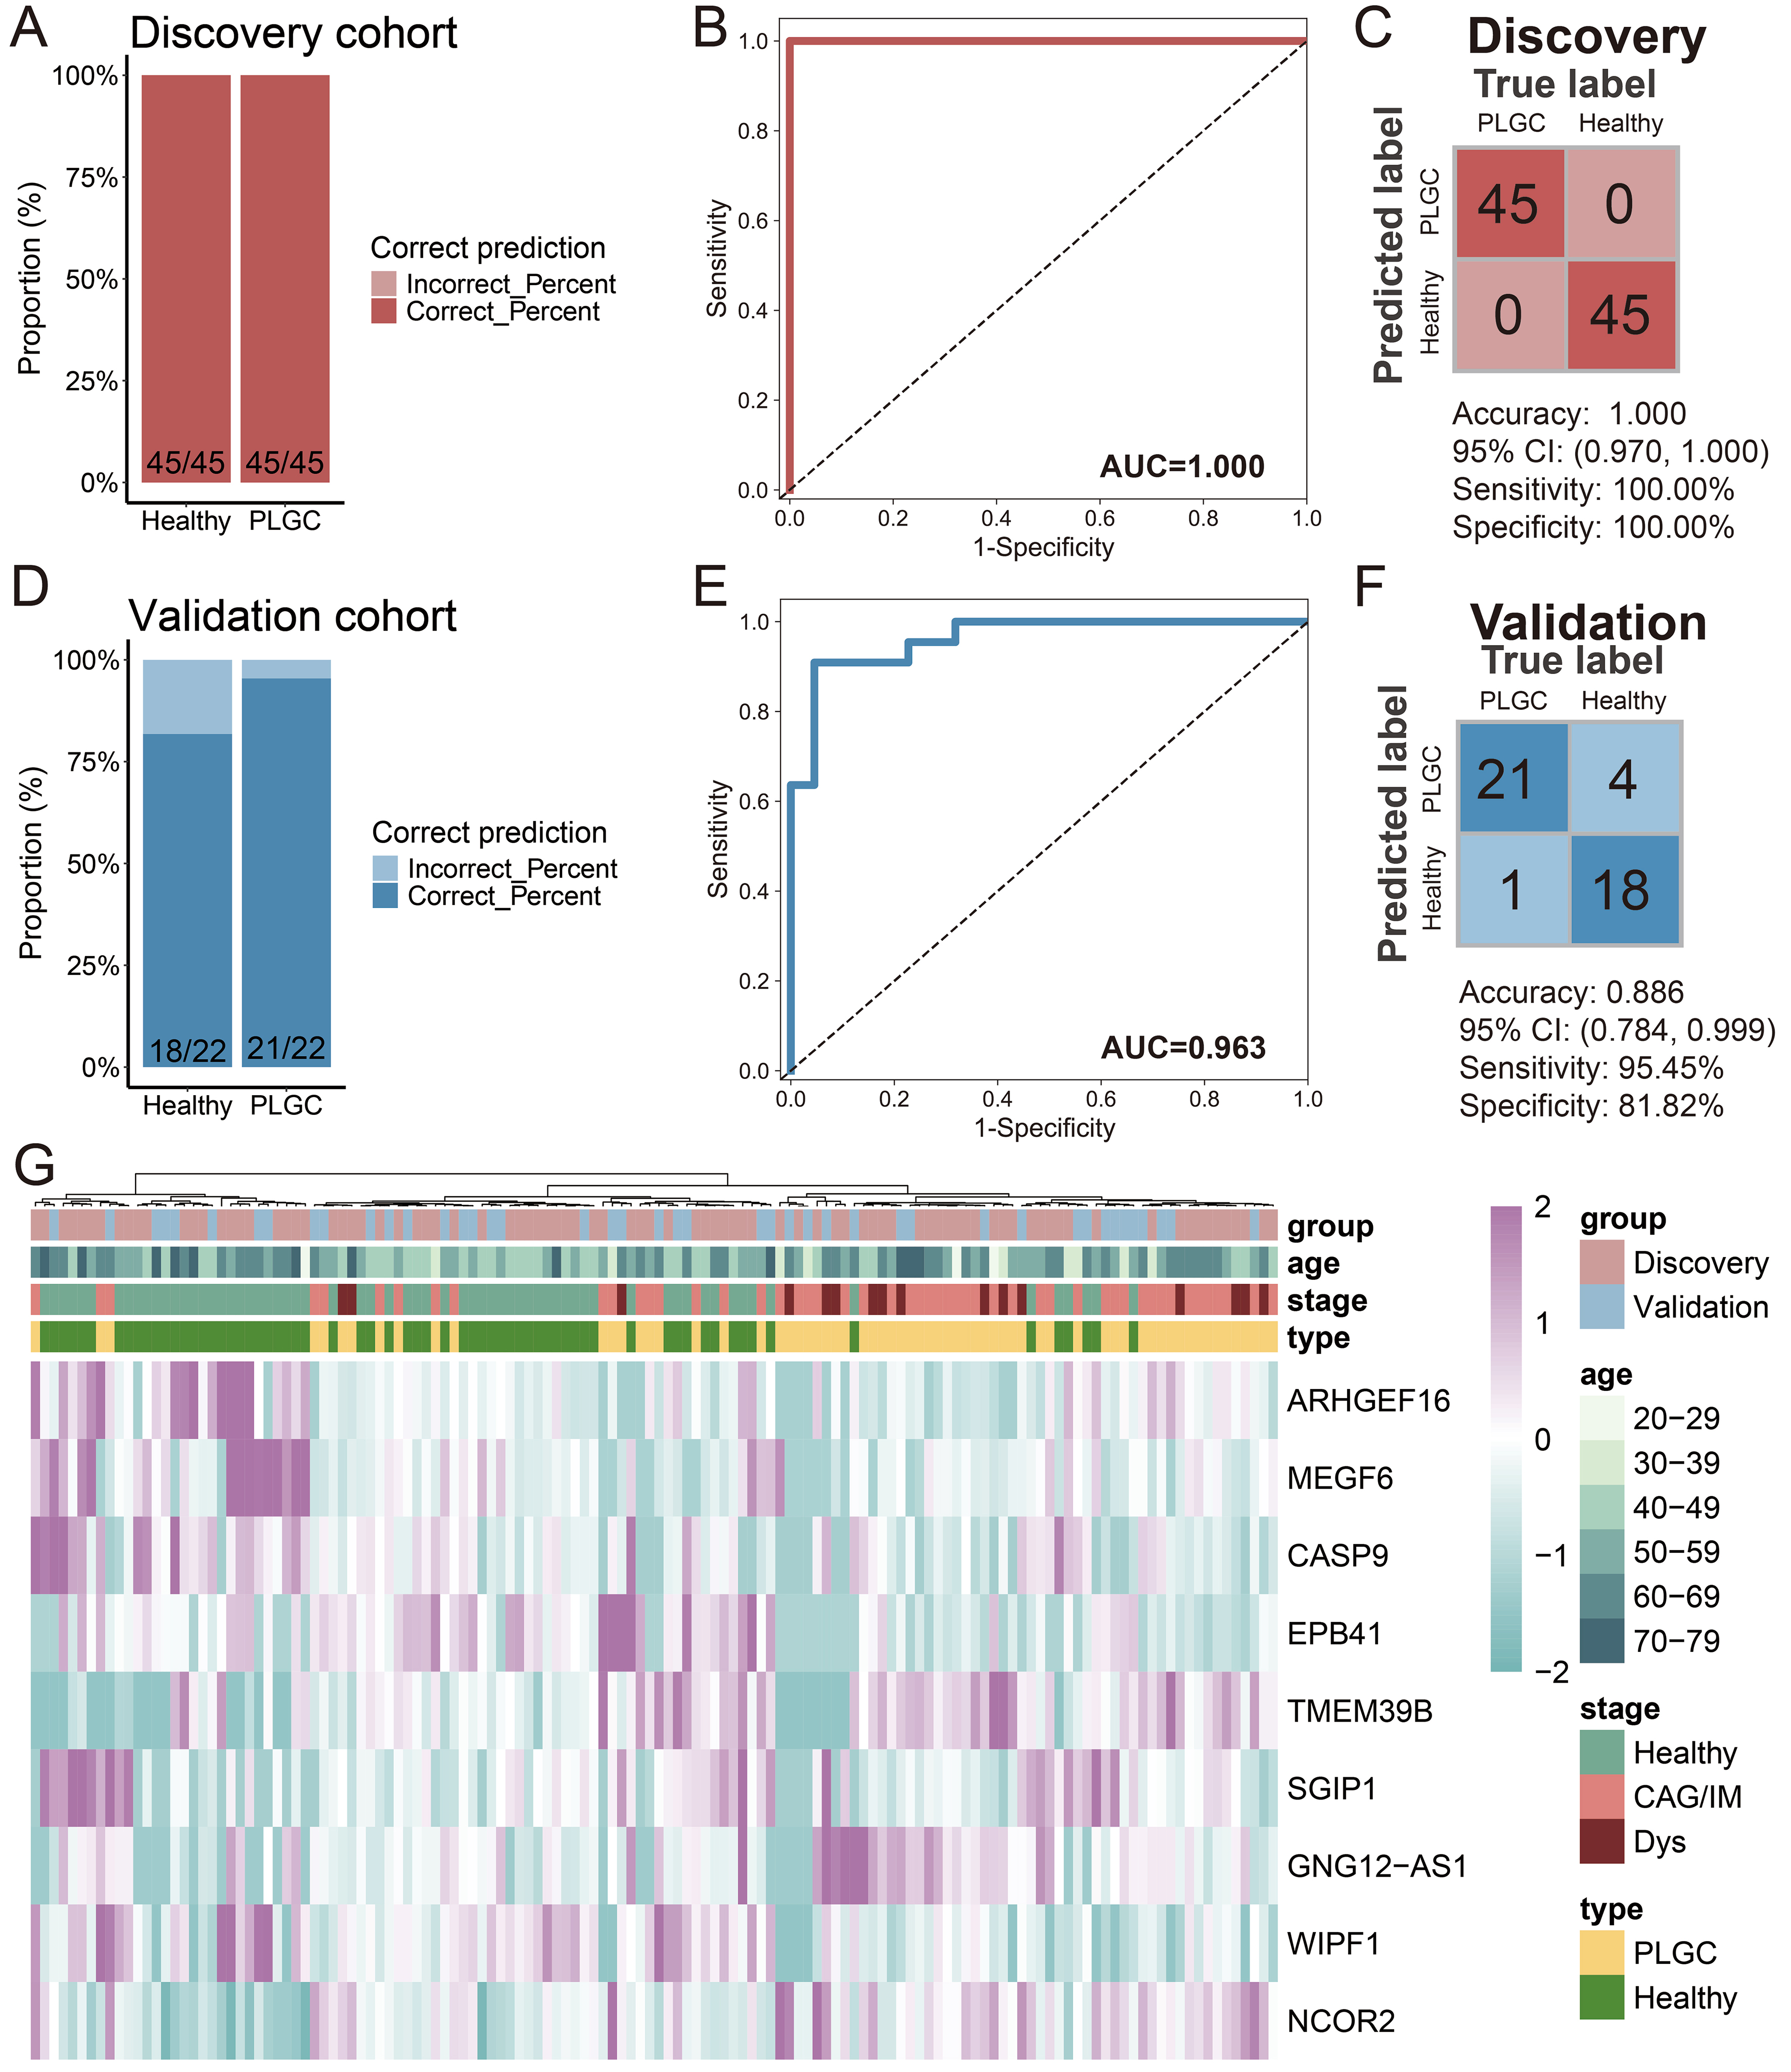
Figure 5. Construction and Validation of the PLGC Diagnostic Model. (A) Stacked bar chart of model prediction results in the training set; (B) ROC curve of the model in the training set; (C) Confusion matrix of the model in the training set; (D) Stacked bar chart of model prediction results in the test set; (E) ROC curve of the model in the test set; (F) Confusion matrix of the model in the test set; (G) Heatmap of DhMGs in the diagnostic model across train and test cohort samples. PLGC: Precancerous lesion of gastric cancer; ROC: receiver operating characteristic; AUC: area under the curve; CAG: chronic atrophic gastritis; IM: intestinal metaplasia; Dys: dysplasia; DhMGs: differentially hydroxymethylated genes.


