


fig3
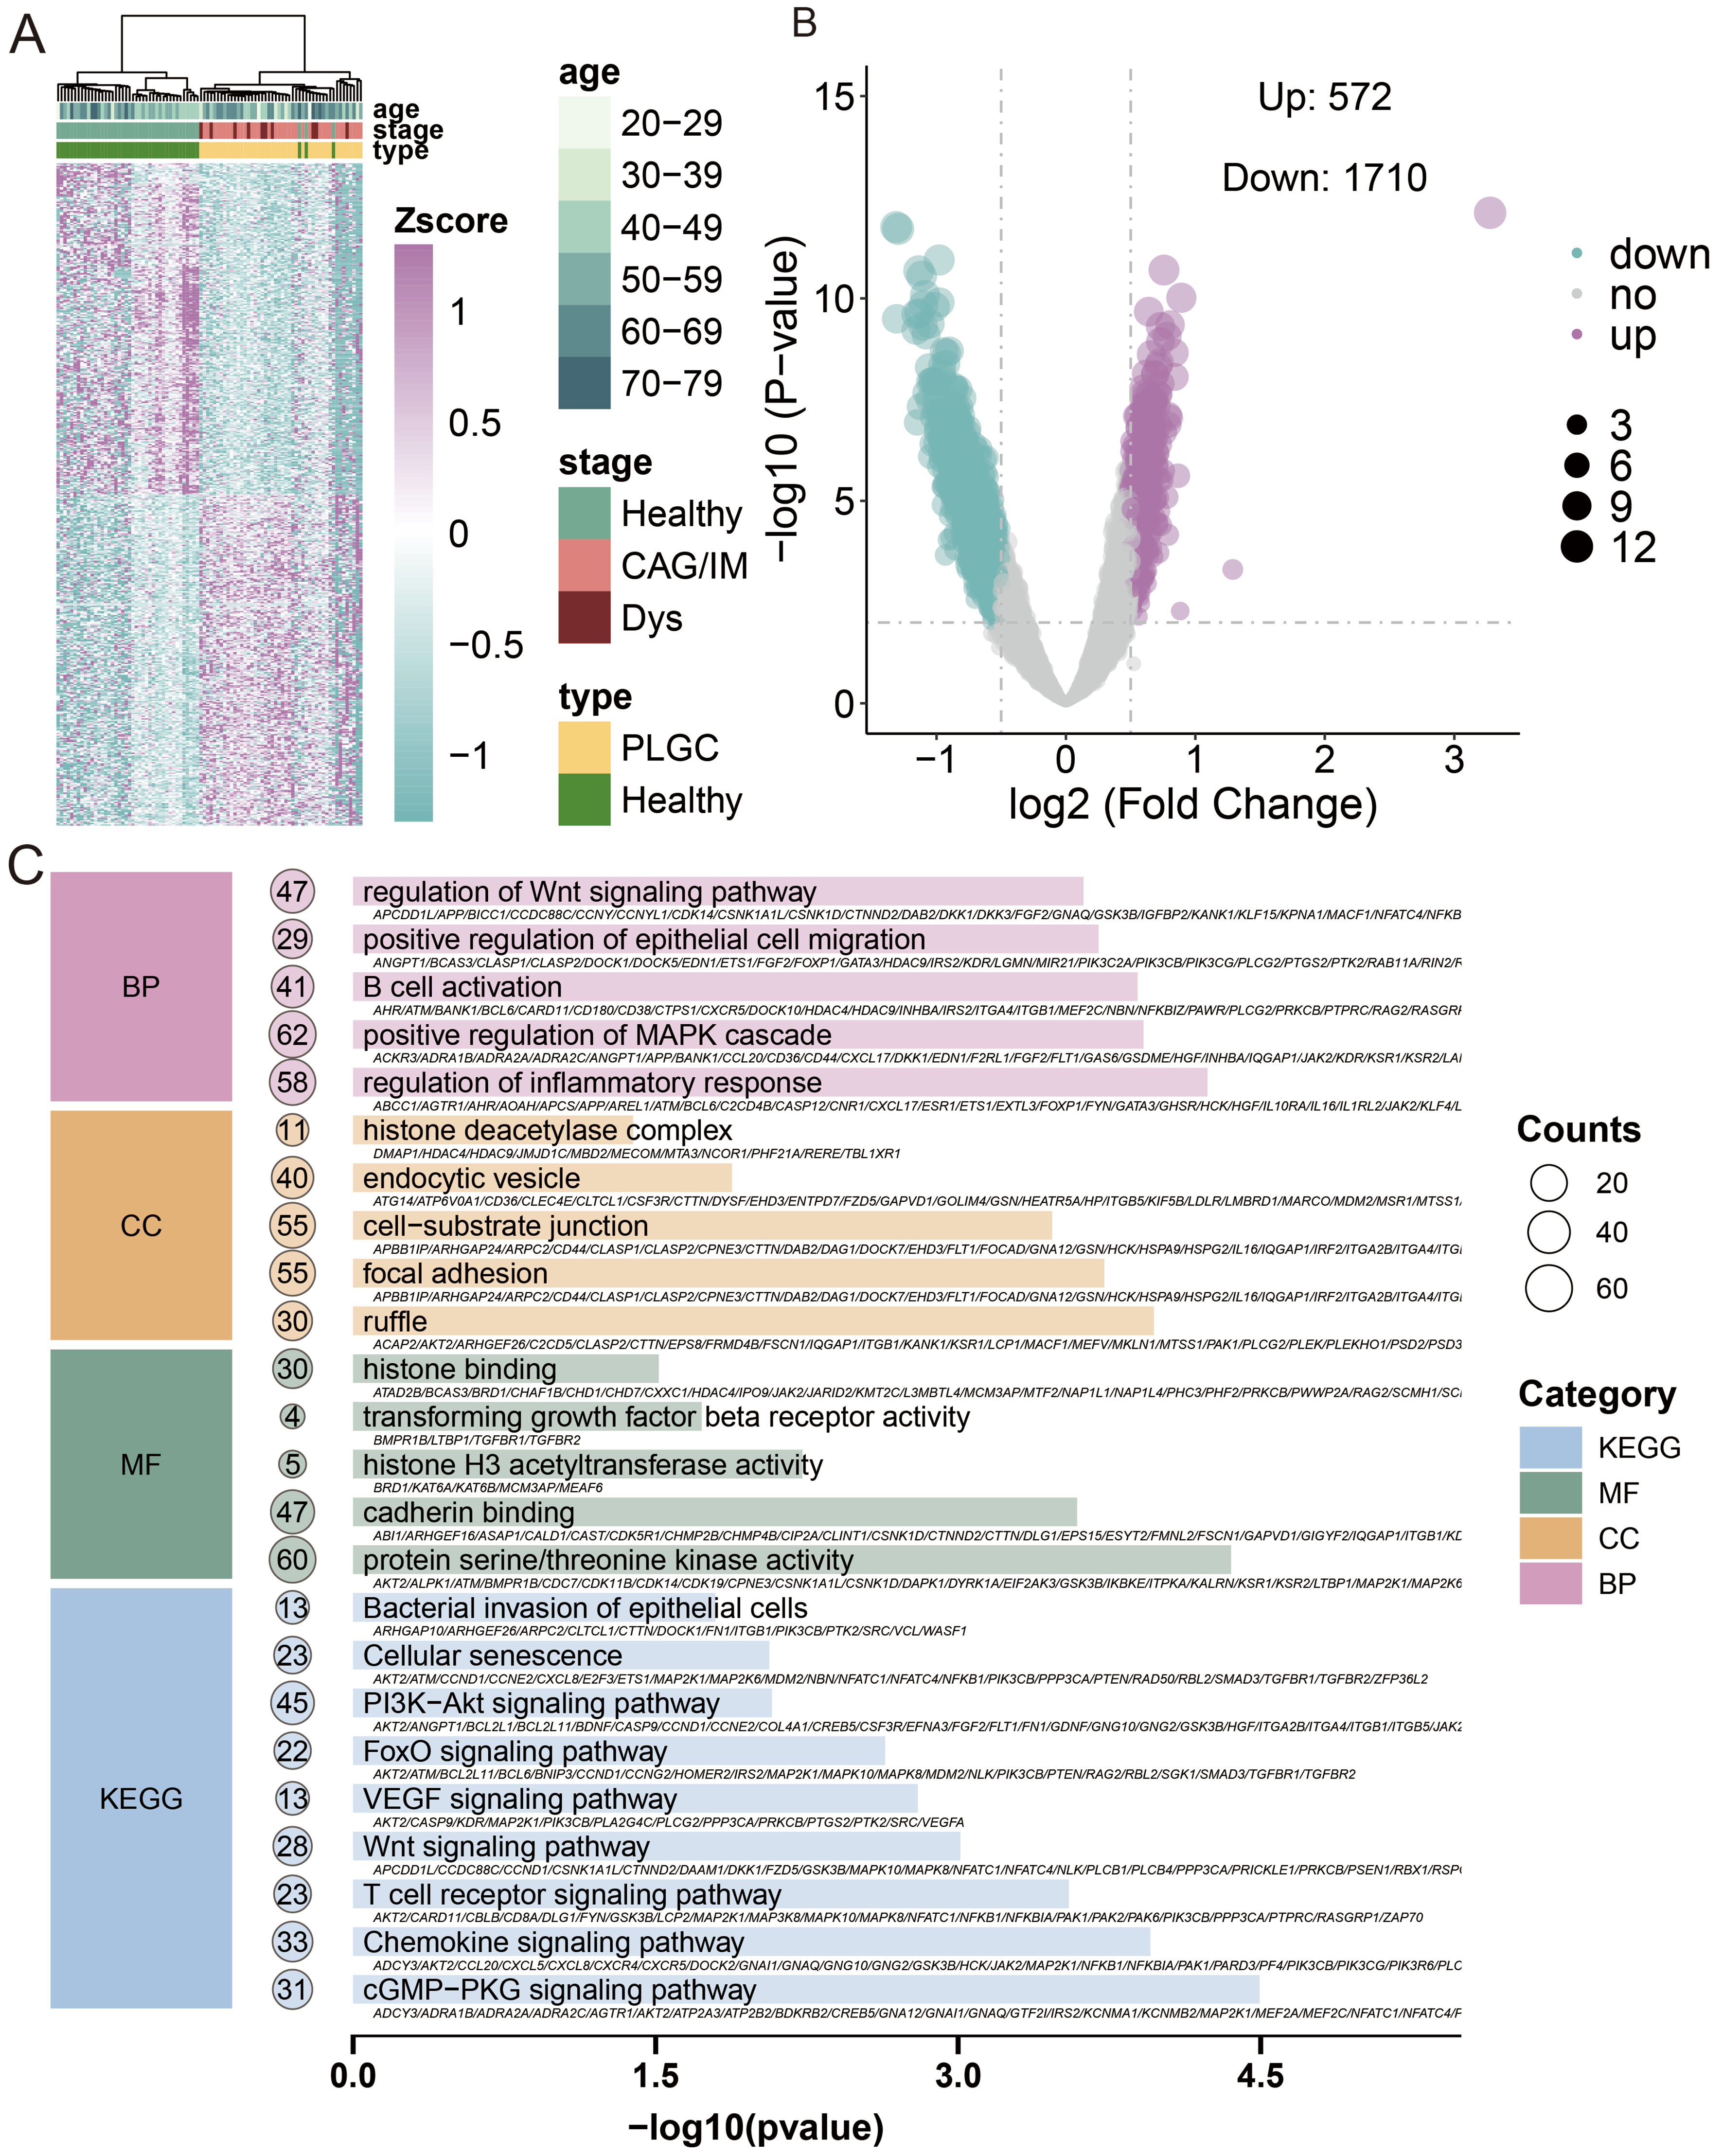
Figure 3. Analysis of 5hmC differences and pathway and function annotations. (A) Heatmap of DhMRs distribution; (B) Volcano plot of DhMRs, with the x-axis representing log2(fold change) and the y-axis representing -log10(P-value). Red indicates upregulation, blue indicates downregulation, and gray indicates no significant change; (C) Results of GO and KEGG pathway enrichment analyses. The x-axis shows -log10(P-value), and the y-axis lists significantly enriched BP, CC, MF, and KEGG pathways. BP: Biological processes; CC: cellular components; MF: molecular functions; PLGC: precancerous lesions of gastric cancer; CAG: chronic atrophic gastritis; IM: intestinal metaplasia; Dys: dysplasia.


