


fig5
From: Assessment of the reproducibility of bacterial membrane vesicle isolation and characterization
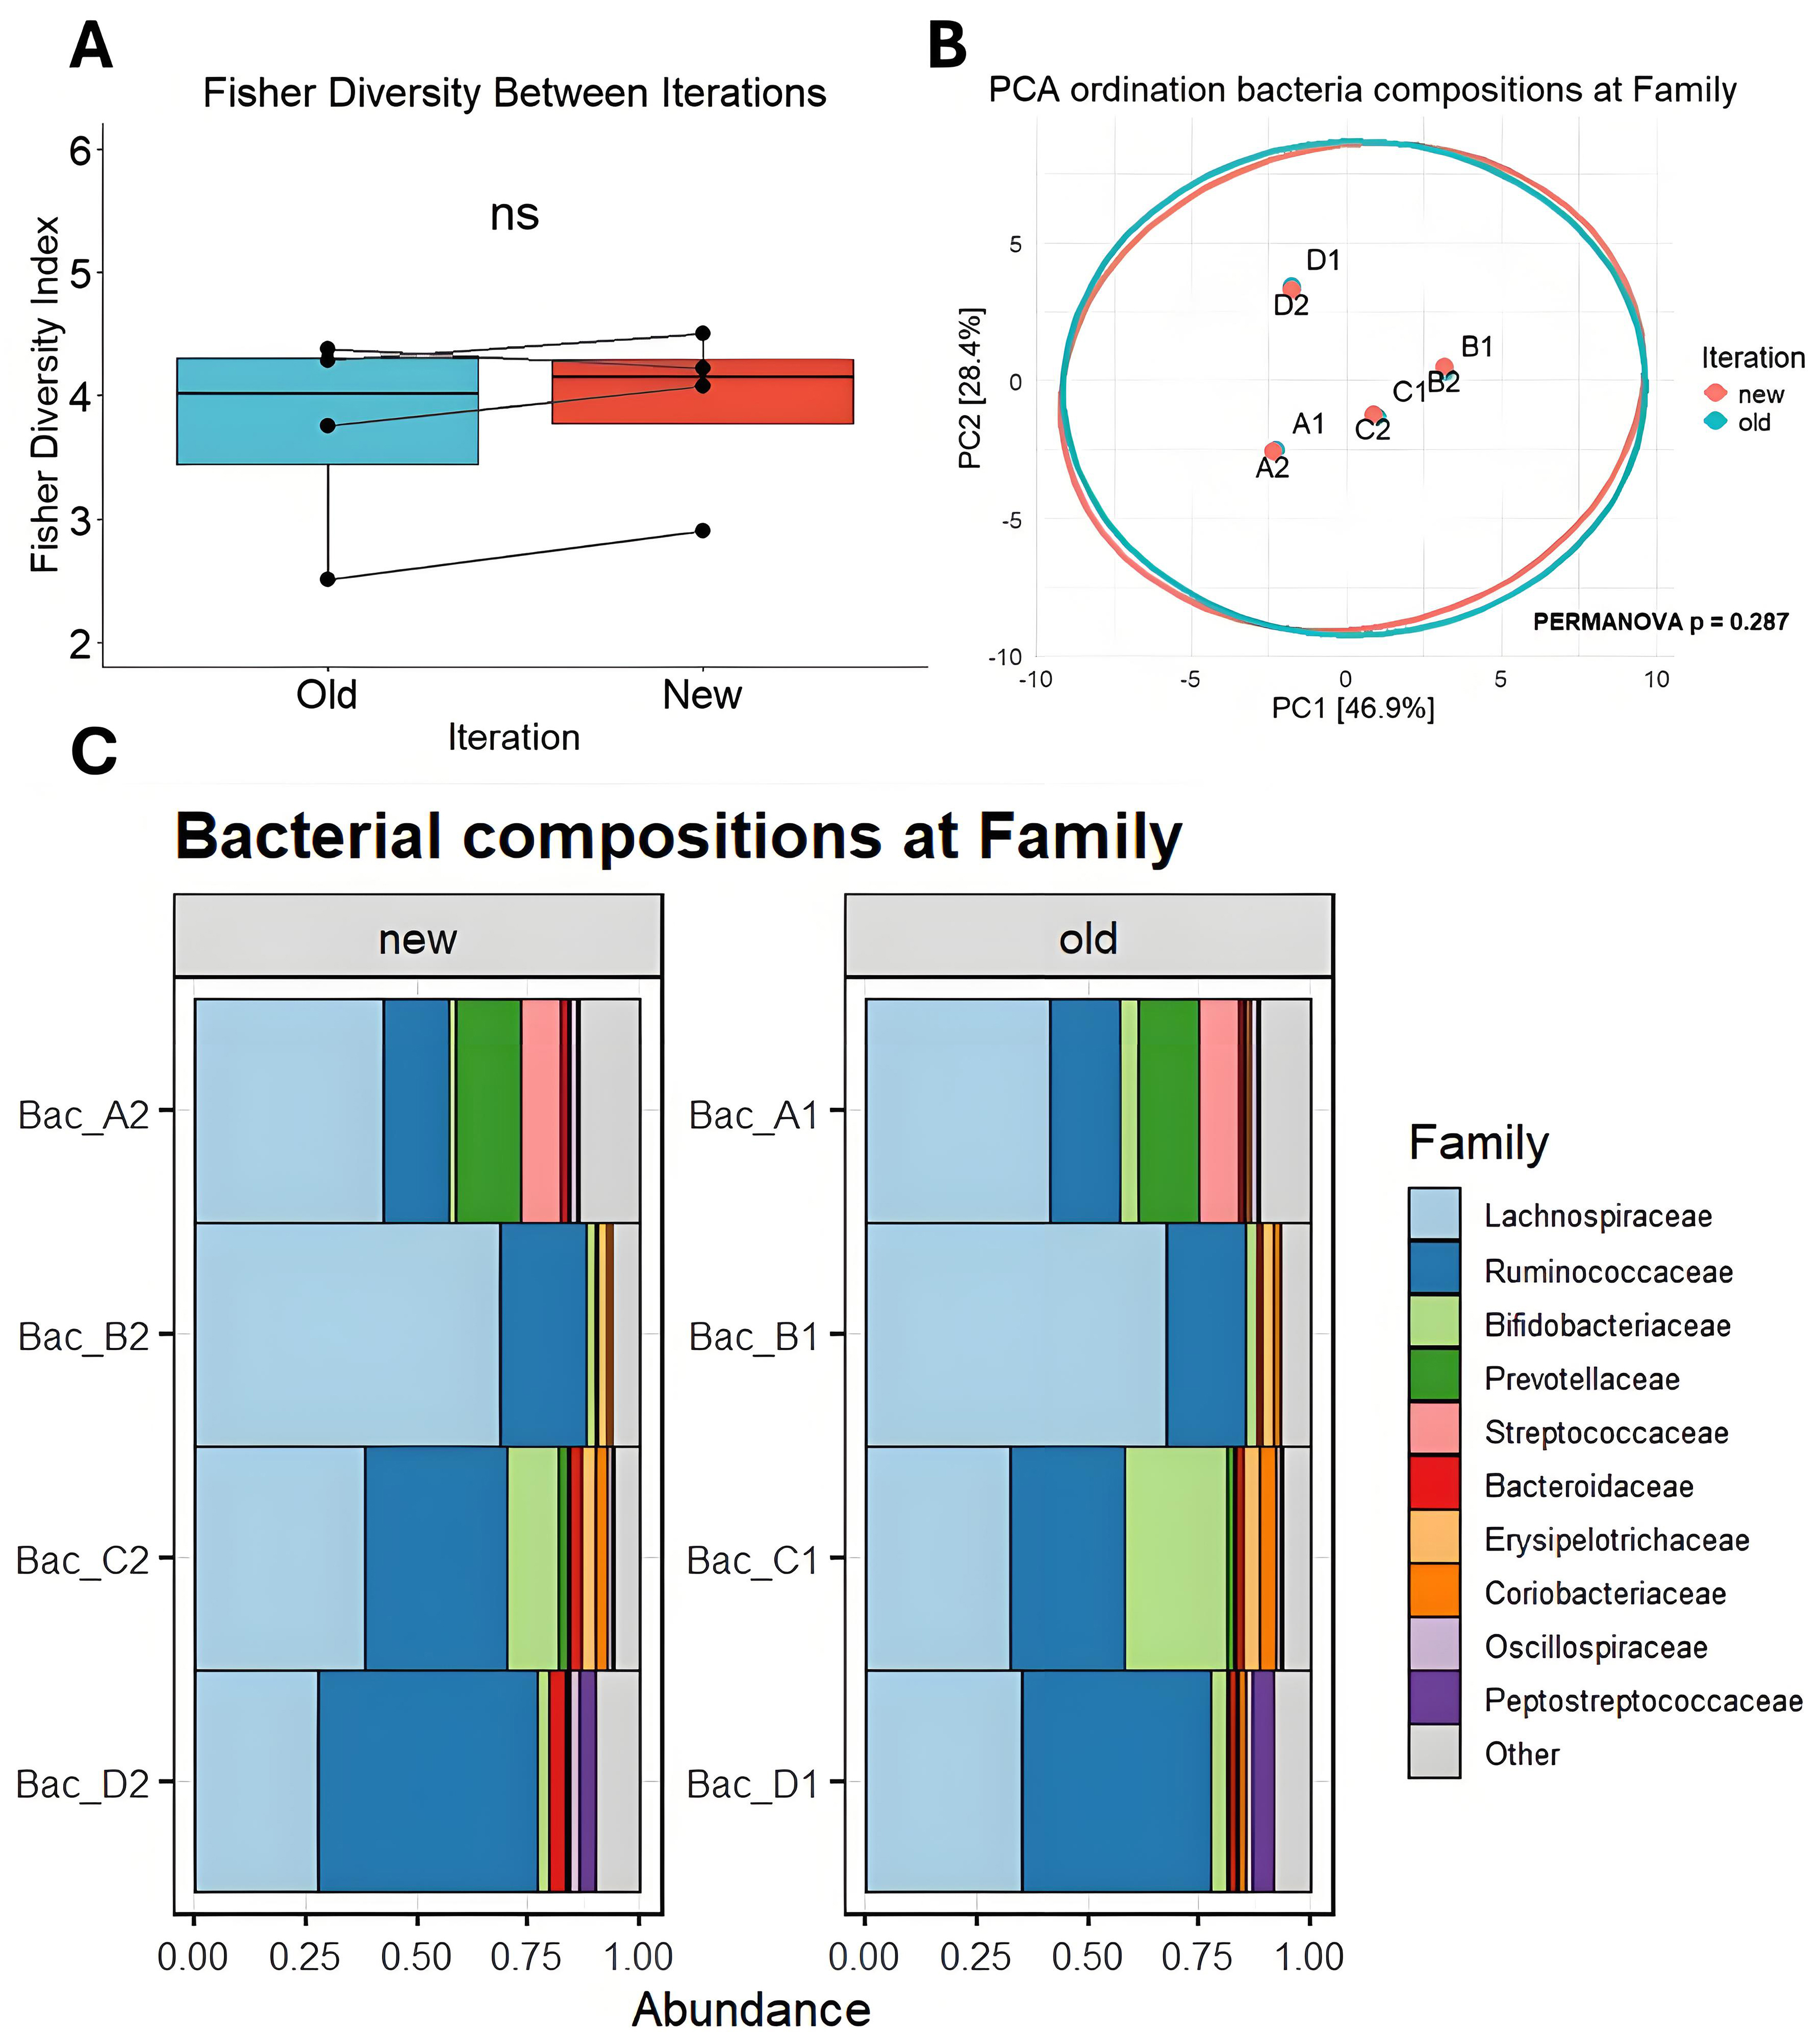
Figure 5. Comparison of bacterial composition across batch years. (A) Fisher’s alpha diversity at family taxonomy; (B) Principal component analysis ordination biplot of CLR-transformed features at the taxonomic Family level. 95% confidence ellipses are drawn per iteration; (C) Bar charts showing the proportional abundance of detected taxa from bacterial DNA at the Family level between iterations. PCA: Principal component analysis; CLR: centered log-ratio; NS: not significant; PERMANOVA: permutational multivariate analysis of variance.


