


fig2
From: Assessment of the reproducibility of bacterial membrane vesicle isolation and characterization
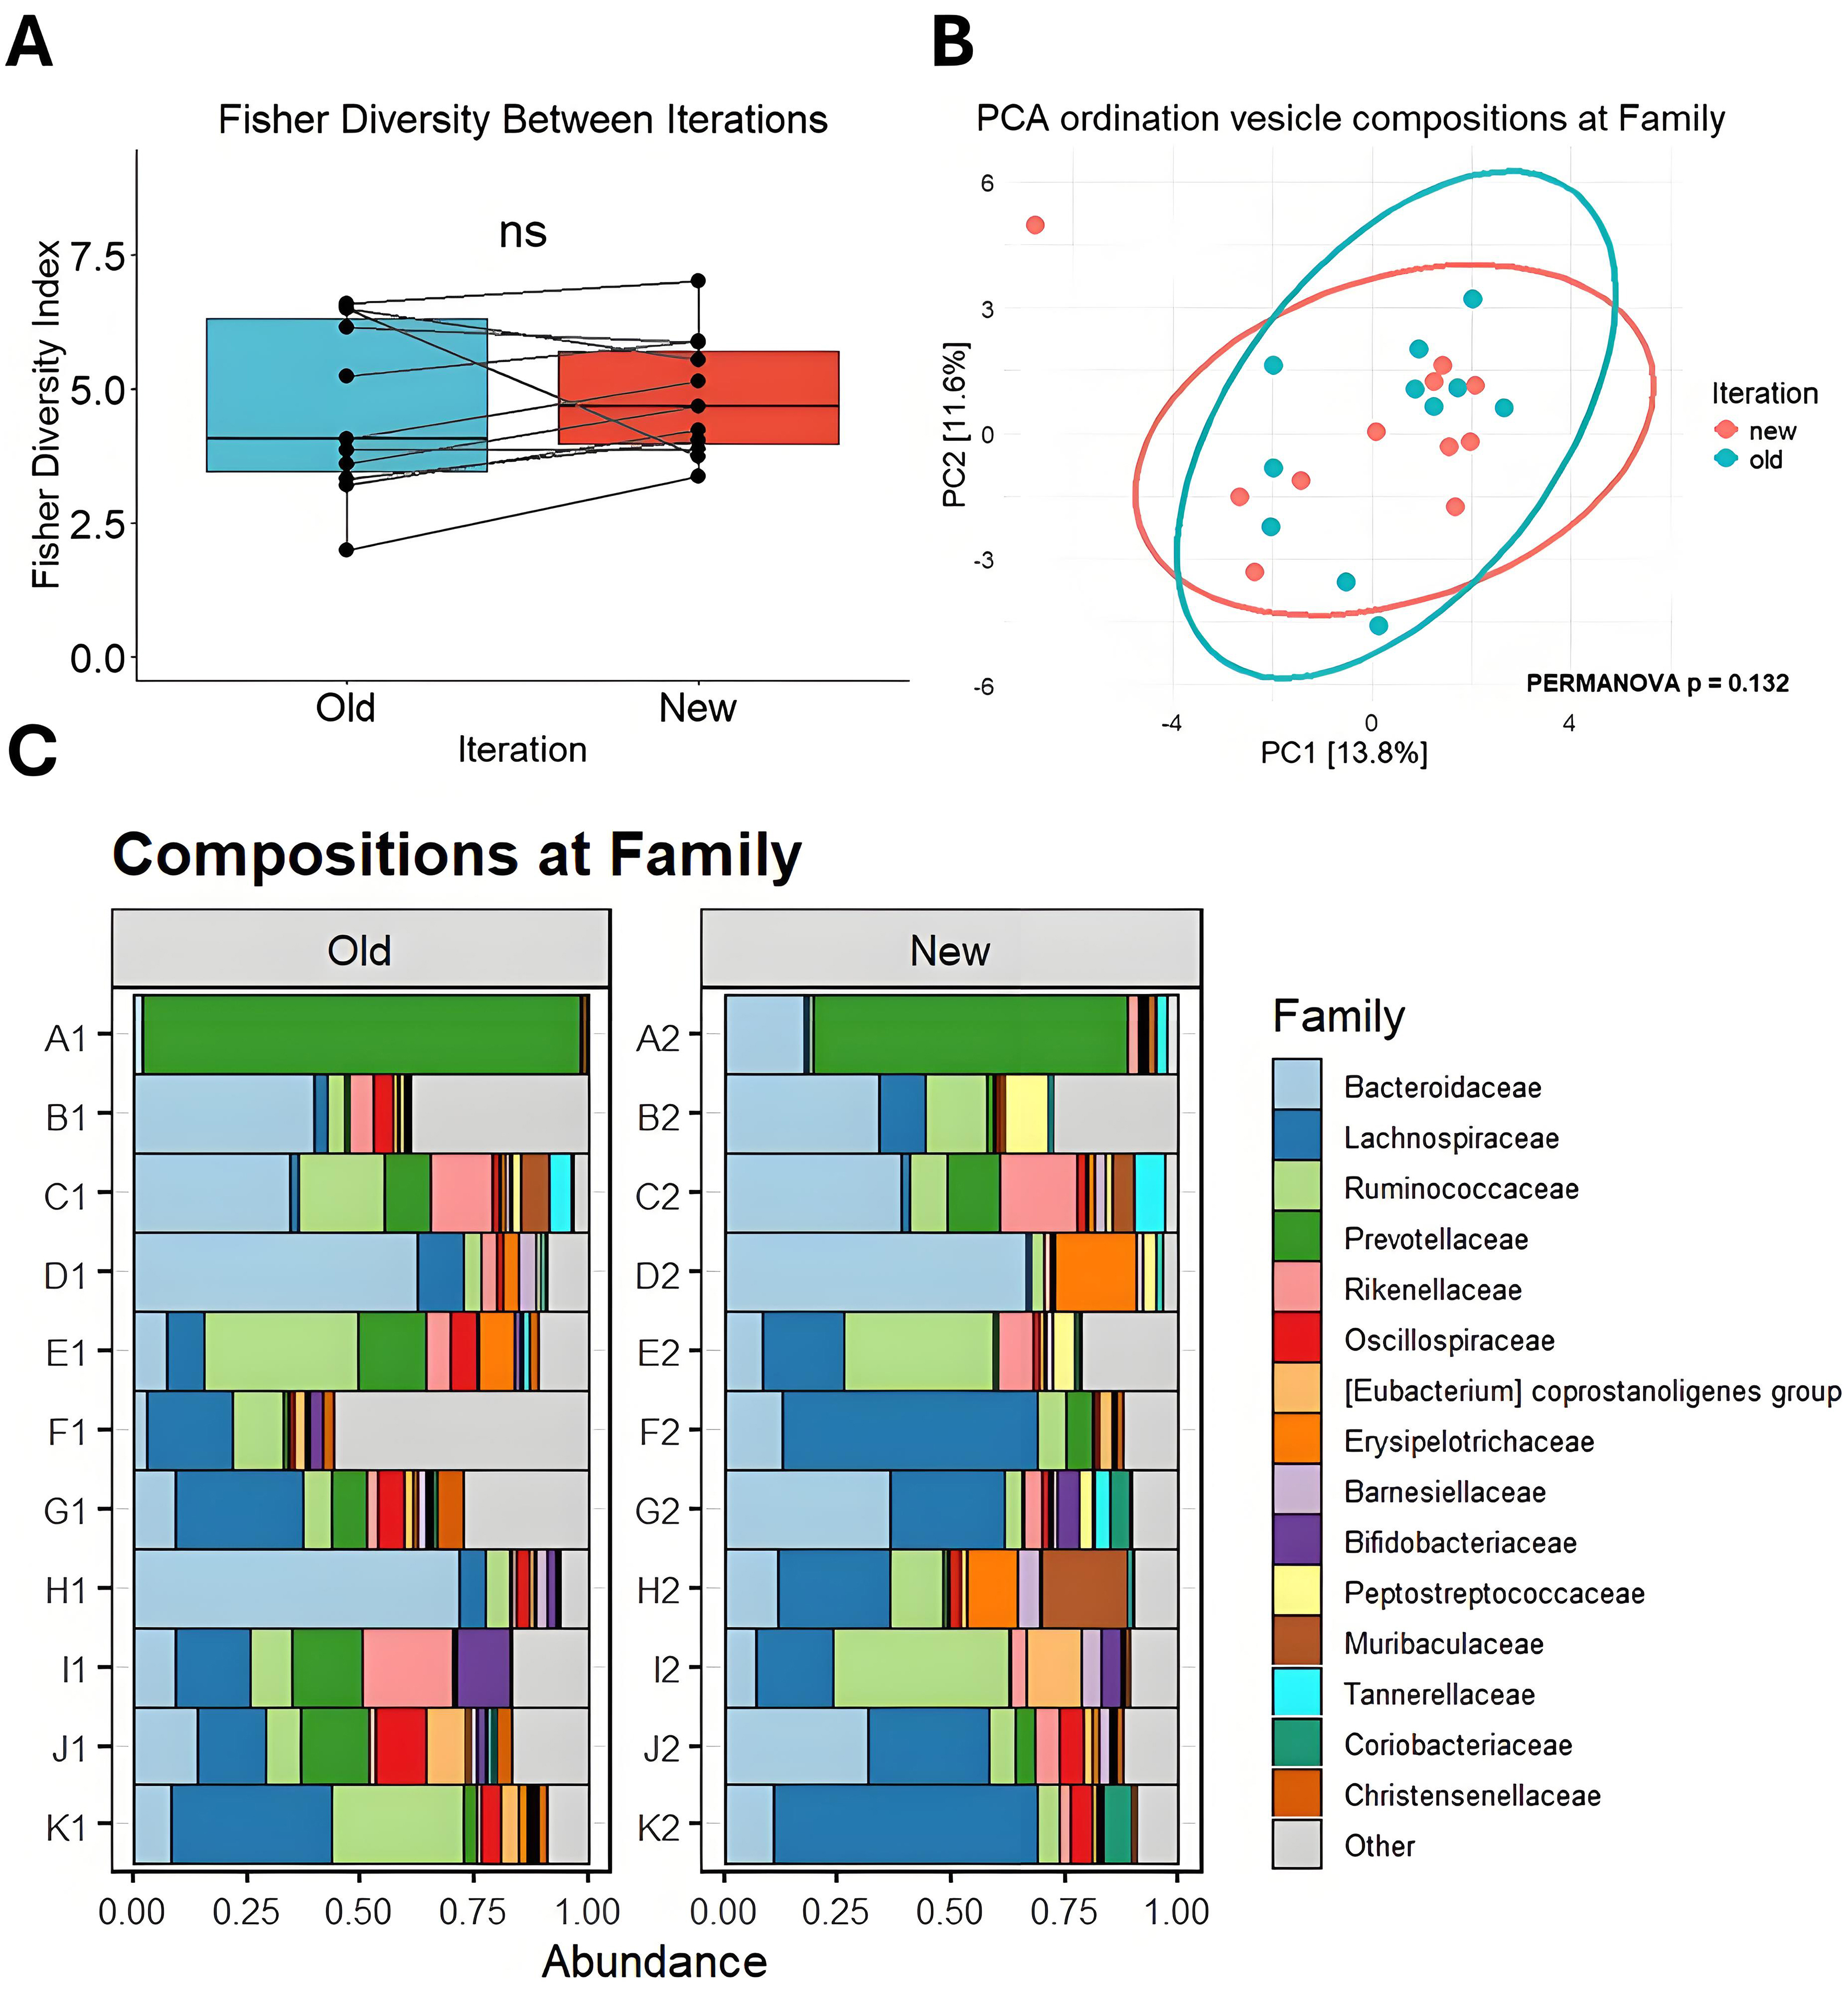
Figure 2. Comparison of bMV compositions between iterations. (A) Fisher’s alpha diversity at family taxonomy. Data are presented as means ± SEM; (B) Principal component analysis ordination biplot of CLR-transformed features at the taxonomic Family level. 95% confidence ellipses are drawn per iteration; (C) Bar charts showing the proportional abundance of detected taxa from vesicle DNA at the Family level between iterations. SEM: Standard error of the mean; bMV: bacterial membrane vesicle; NS: not significant; PCA: principal component analysis; CLR: centered log-ratio; PERMANOVA: permutational multivariate analysis of variance.


