


fig6
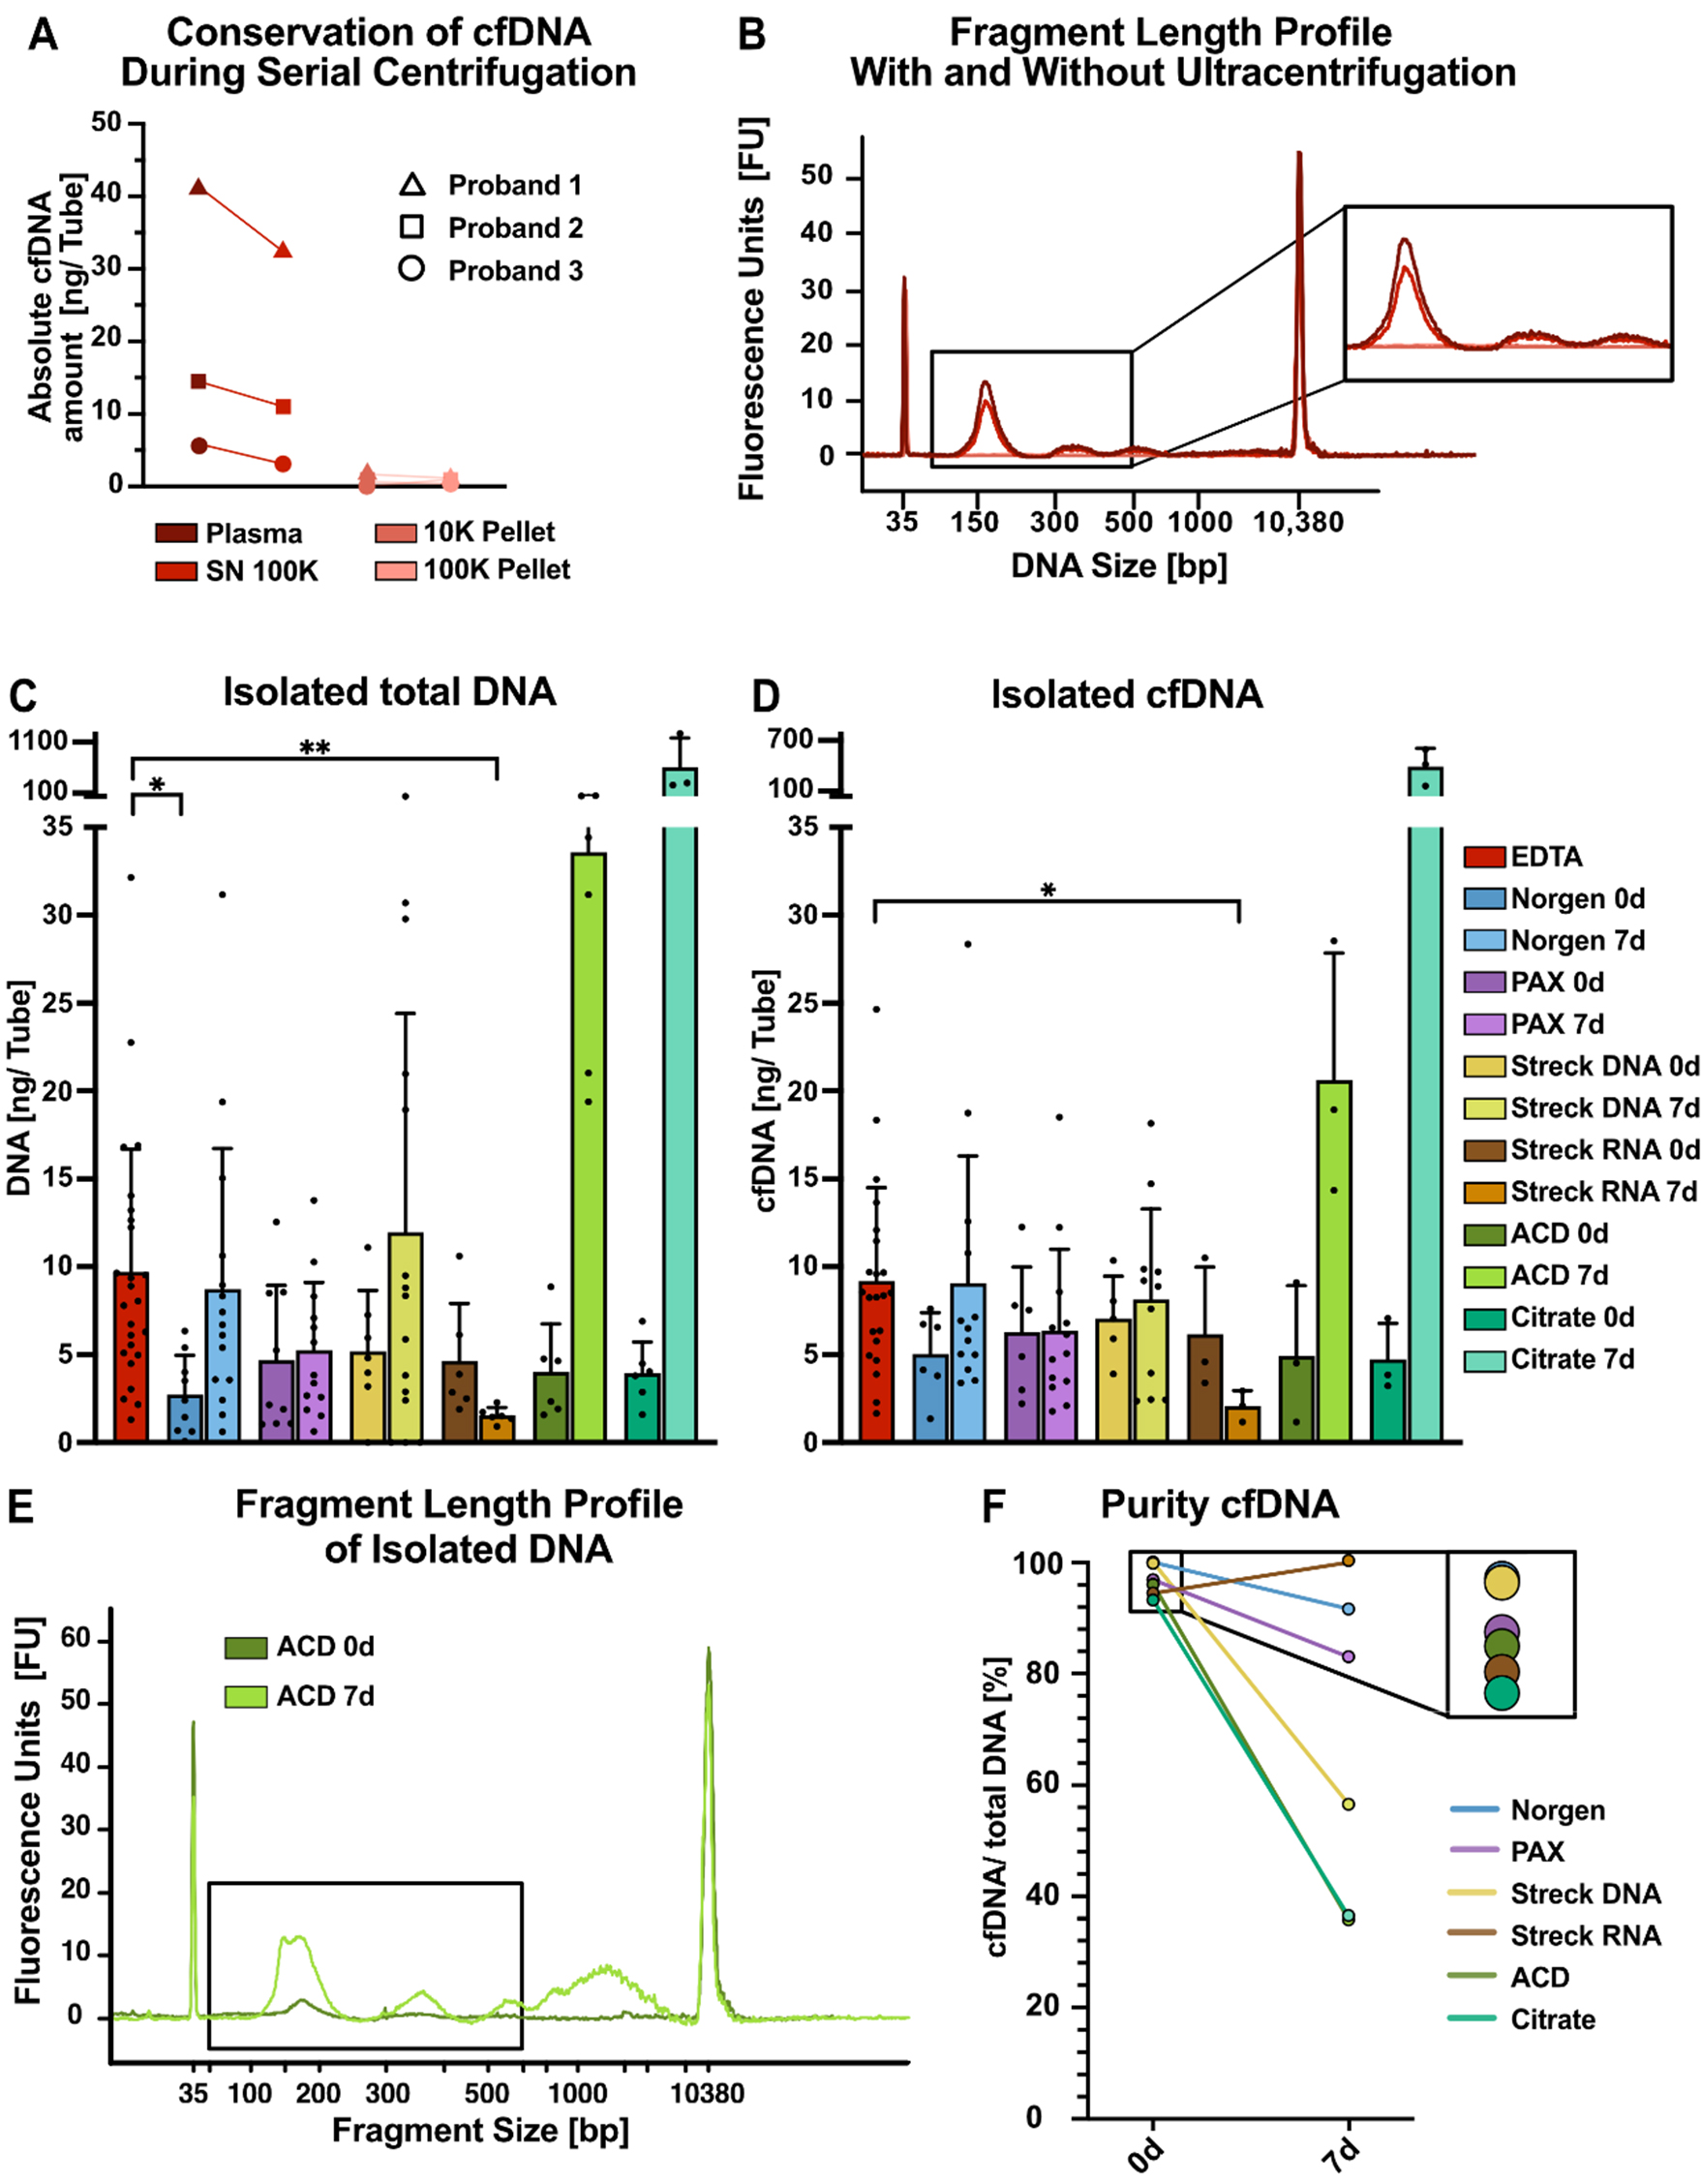
Figure 6. Serial isolation of cfDNA and EVs from tube candidates. (A) Absolute cfDNA amounts measured with Qubit DNA quantification for three individuals; (B) Bioanalyzer (BA) profiles of representative individuals in the indicated plasma fractions from EDTA tubes, e.g., in plasma before ultracentrifugation (dark red), in plasma supernatant after 100 K ultracentrifugation (red), in the 10 K pellet (pink), and in the 100 K pellet (light pink); (C) Absolute amounts of total DNA and (D) cfDNA per tube recovered from 100 K supernatants from the indicated tubes. DNA was isolated via NucleoSnap, and cfDNA was quantified via BA profiles. The size of cfDNA wrapped around one nucleosome can range from approximately 146 to 176 bp and is represented by the first peak at approximately 160 bp; the second and third peaks are represented by multiples thereof; (E) Exemplary BA profiles for DNA isolated from ACD tubes after immediate processing (dark green) and after 7 days (light green), highlighting the increase in genomic DNA contamination over time. The black box indicates the expected size of cfDNA; (F) cfDNA purity of DNA isolations defined as the ratio of cfDNA (first nucleosomal peak) to total DNA (50-7,000 bp) measured by BA. Statistical significance in (C) and (D) was determined for all tube candidates via the Kruskal-Wallis test, followed by Dunn’s multiple comparisons test. *P < 0.05, **P < 0.01. Only statistically significant differences compared with EDTA are shown in the graphs; nonsignificant results are not marked. cfDNA: Cell-free DNA; EVs: extracellular vesicles; lEVs: large EVs; sEVs: small EVs.


