


fig5
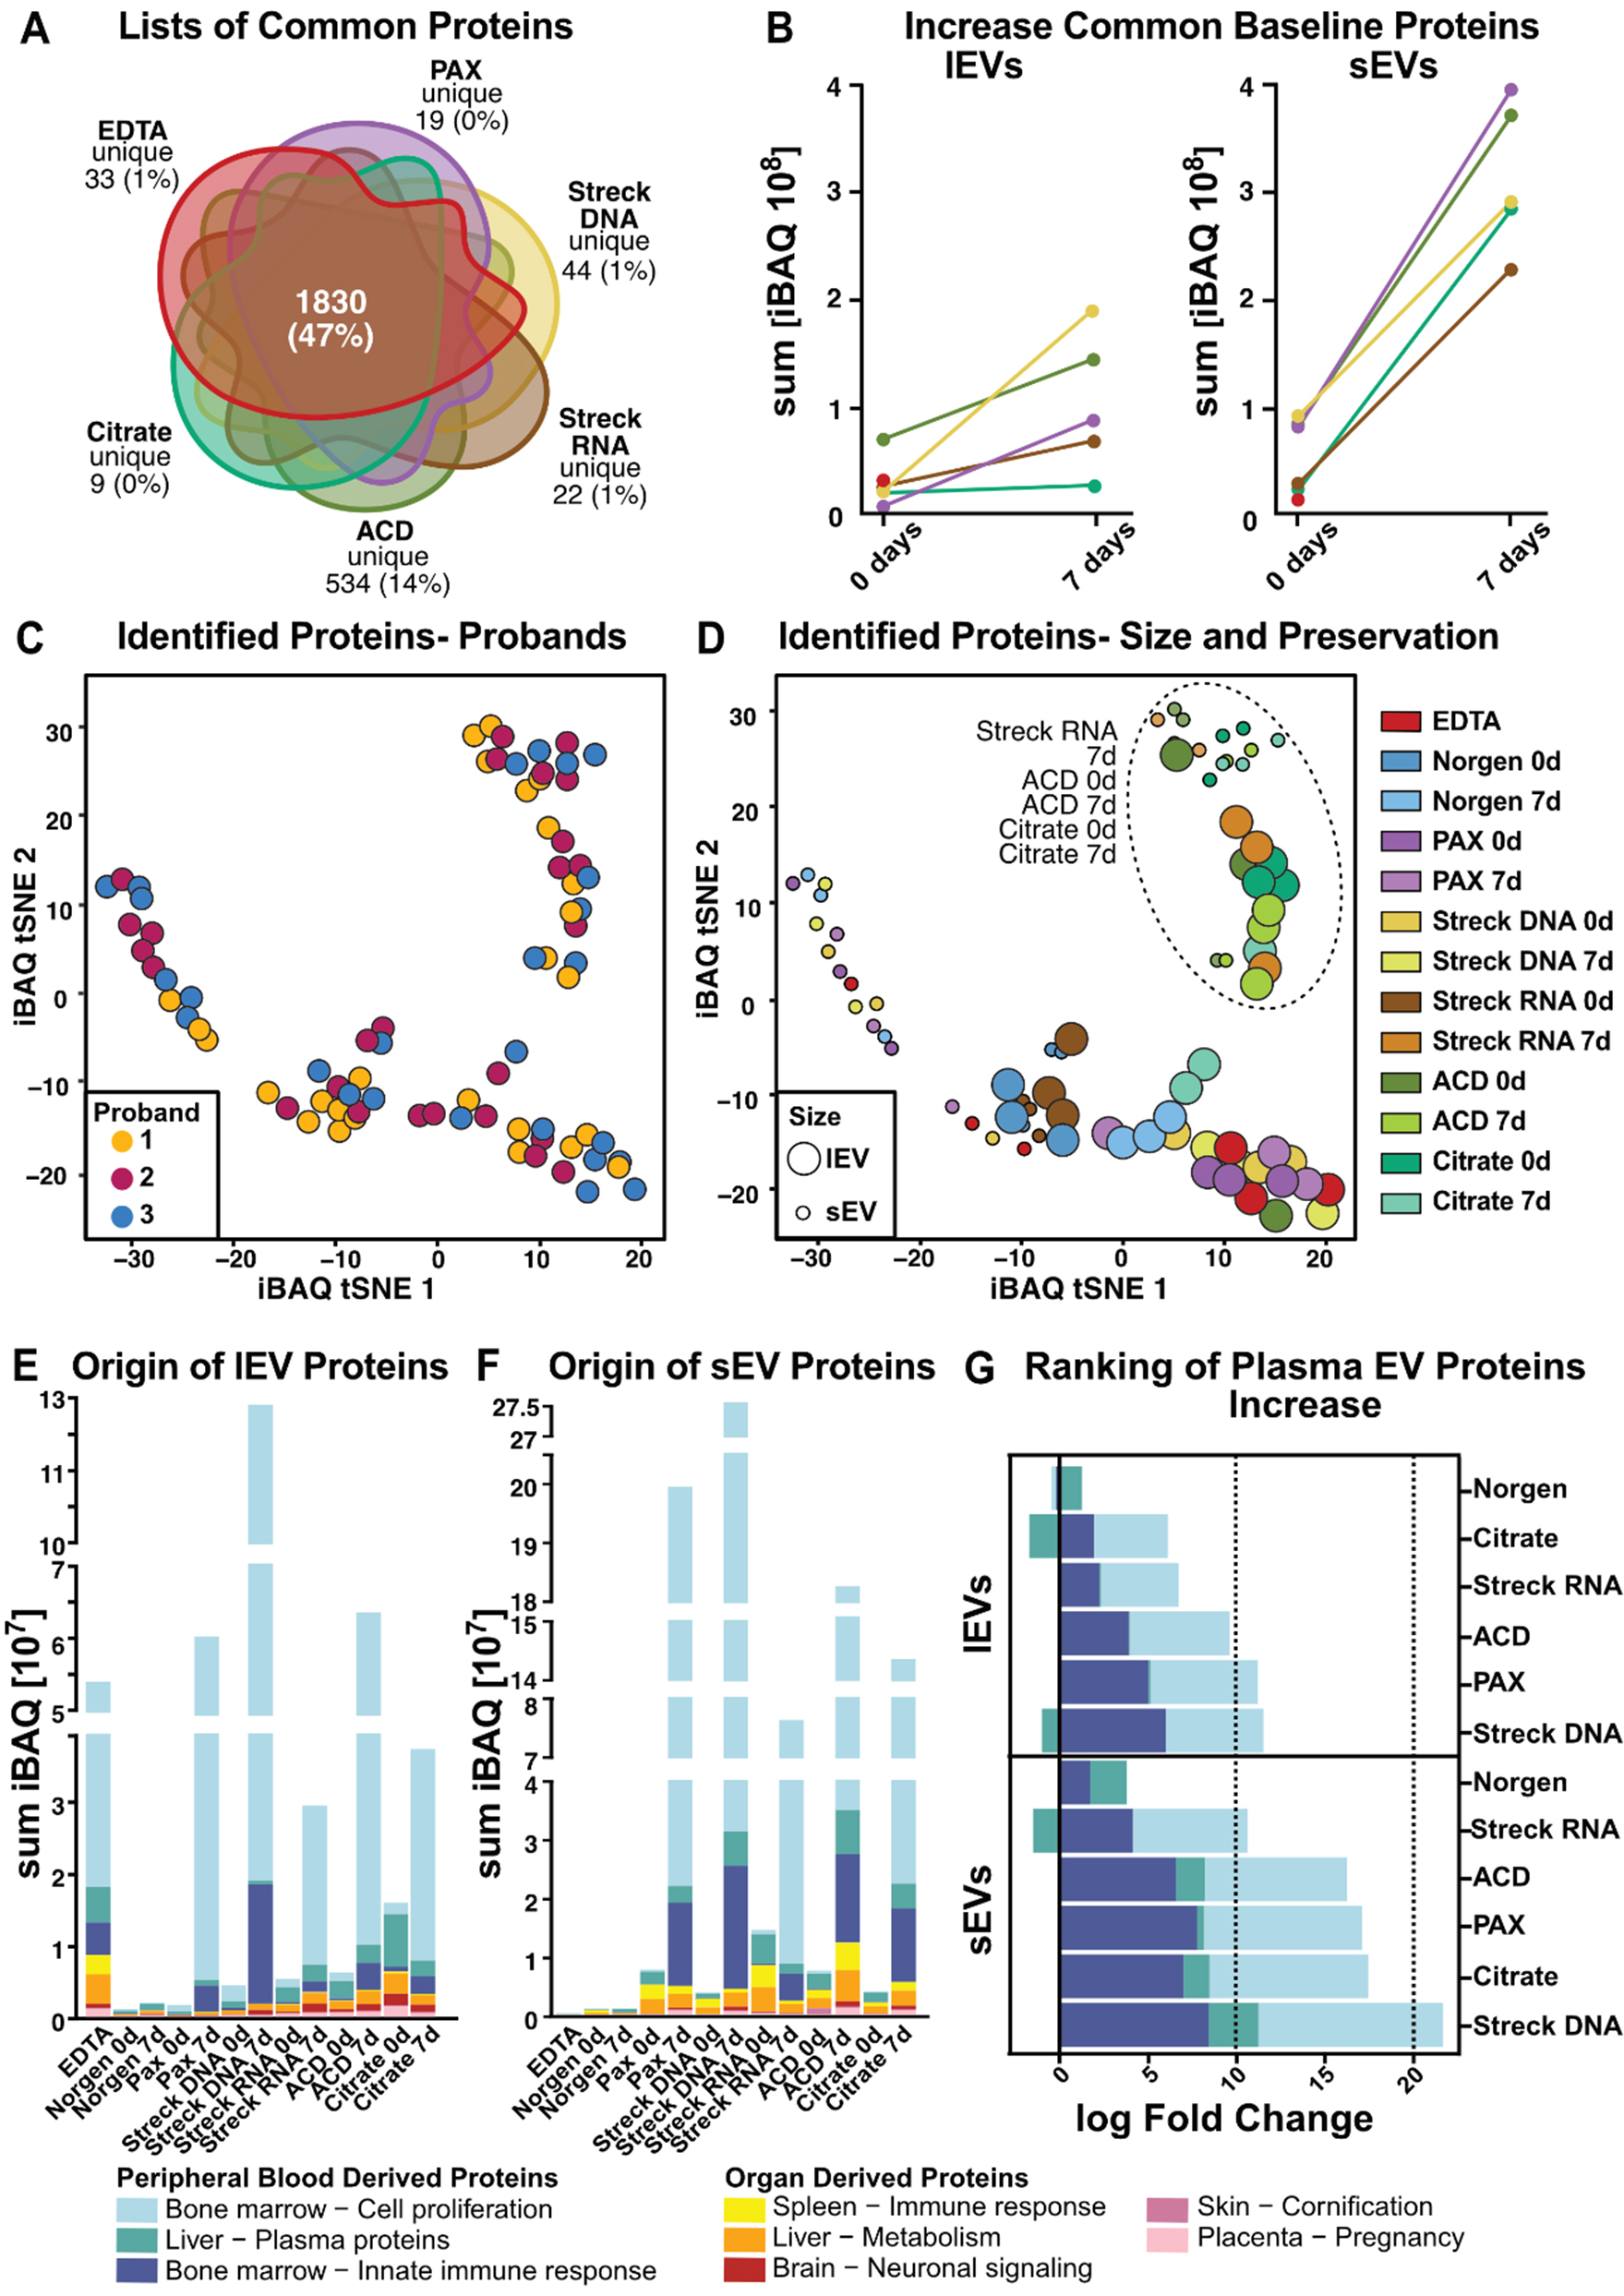
Figure 5. Comprehensive characterization of the lEV and sEV proteomes. (A) Venn diagram illustrating the overlap of mass spectrometry-identified proteins per tube. Norgen was excluded because it did not meet the threshold due to insufficient sample quantity; (B) Increase in standard 0-day baseline EV protein iBAQ values over time; (C) t-SNE clustering with participant individual color codes. Each dot represents the iBAQ proteome values of individual EV samples, with each participant indicated by different colors or (D) with processing time (0 d or 7 d) and blood tube (EDTA, Norgen, PAX, Streck DNA, Streck RNA, ACD, and Citrate) indicated. (E and F) Tissue origin predictions for (E) lEV and (F) sEV iBAQ protein values; (G) iBAQ log fold change of plasma proteins (defined as bone marrow-cell proliferation, liver-plasma proteins and the bone marrow-inorganic immune response) during storage for 7 vs. 0 d. Norgen was excluded from Figure 5A and B because it fell below the threshold due to the limited protein amount isolated. EV: Extracellular vesicle; lEVs: large EV; sEVs: small EV; t-SNE: t-distributed stochastic neighbor embedding; iBAQ: intensity-based absolute quantification.


