


fig4
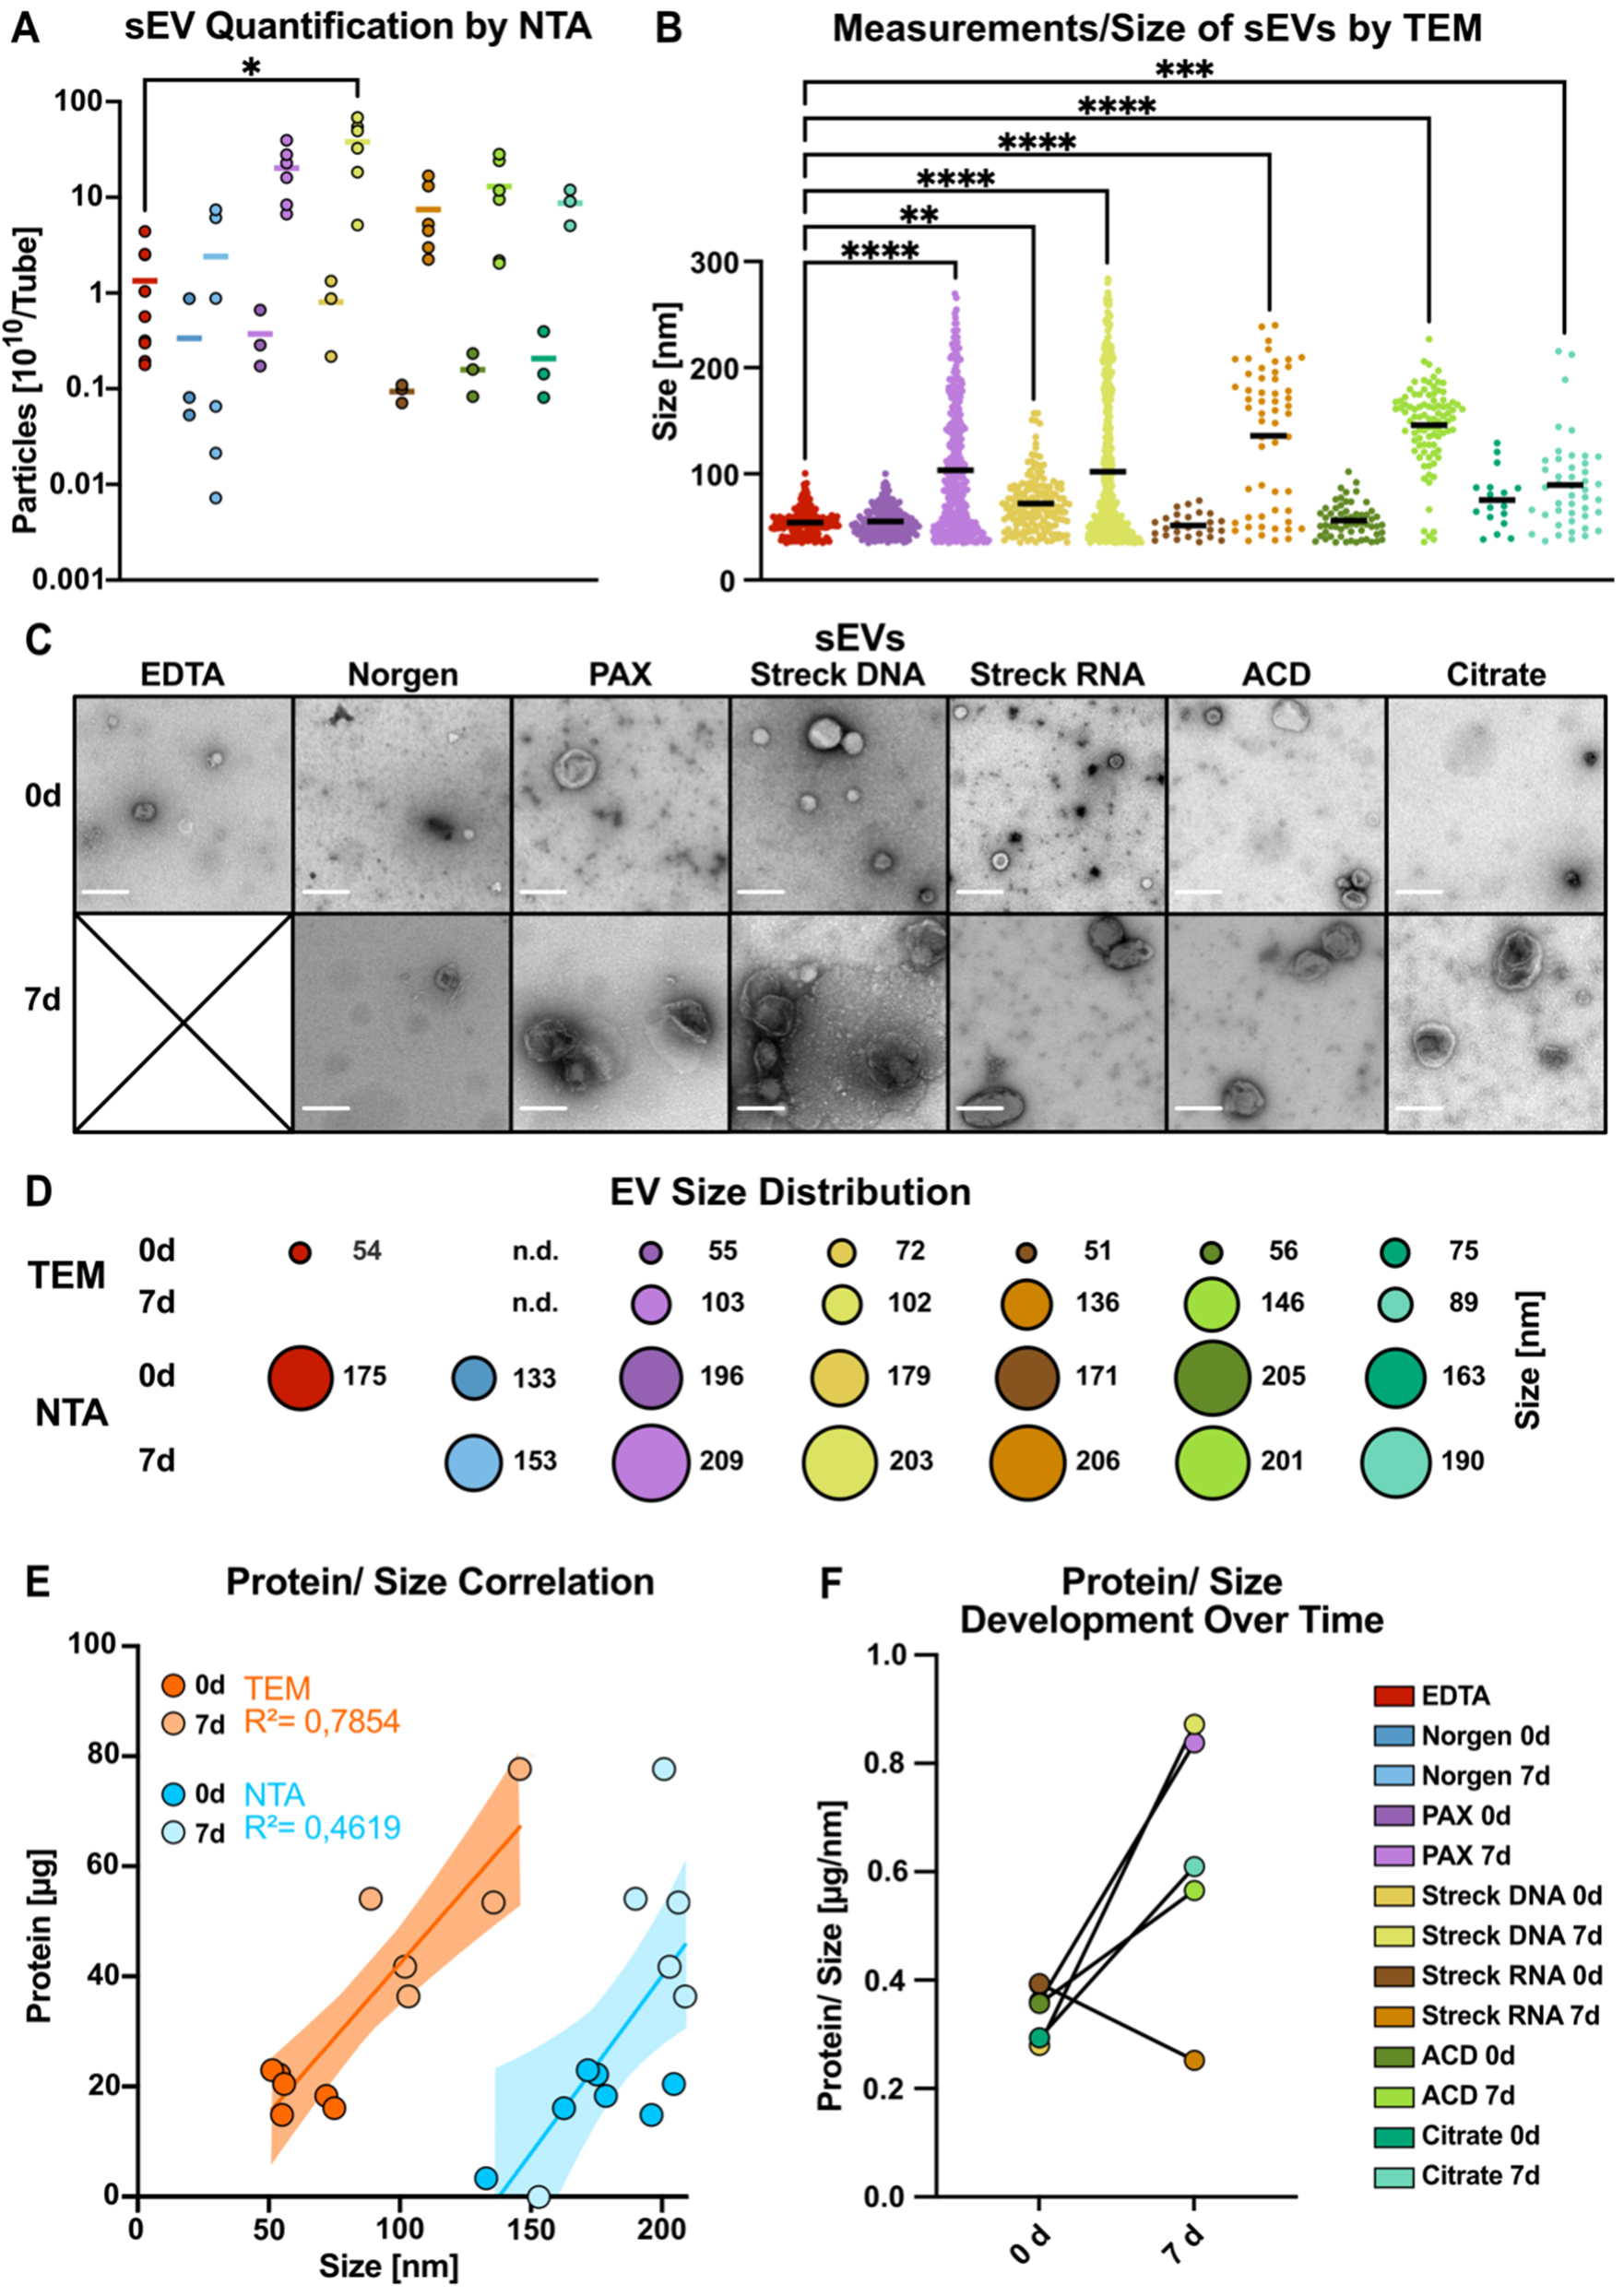
Figure 4. Methodological comparison of the size and integrity of sEVs. (A) NTA quantification of particle numbers in three pooled sEV peak fractions; (B) sEV particle diameter measured via negative EM staining; (C) Negative-staining electron microscopy (TEM) image of sEVs after immediate processing (< 1 h) and after long-term storage for 7 days (scale bar = 200 nm); (D) The mean size of sEVs was measured via negative EM staining (top) and NTA (bottom); (E) Correlations of protein contents and estimated sEV sizes measured via EM images (dark orange, 0 d; light orange, 7 d) and NTA images (dark blue, 0 d; light blue, 7 d) for all the tube candidates; (F) Changes in the protein-to-size ratio of sEVs plotted for immediately processed samples and after 7 days of storage in the indicated tubes. Norgen did not meet the threshold and was therefore excluded from the EM analysis [Figure 3B and F]. The color code in (F) applies to all the graphs in this figure. Statistical significance for (A) was determined for all tube candidates via the Kruskal-Wallis test, followed by Dunn’s multiple comparisons test. *P < 0.05; (B) ANOVA was used for multiple comparisons, followed by the Sidak test. **P < 0.01,


