


fig3
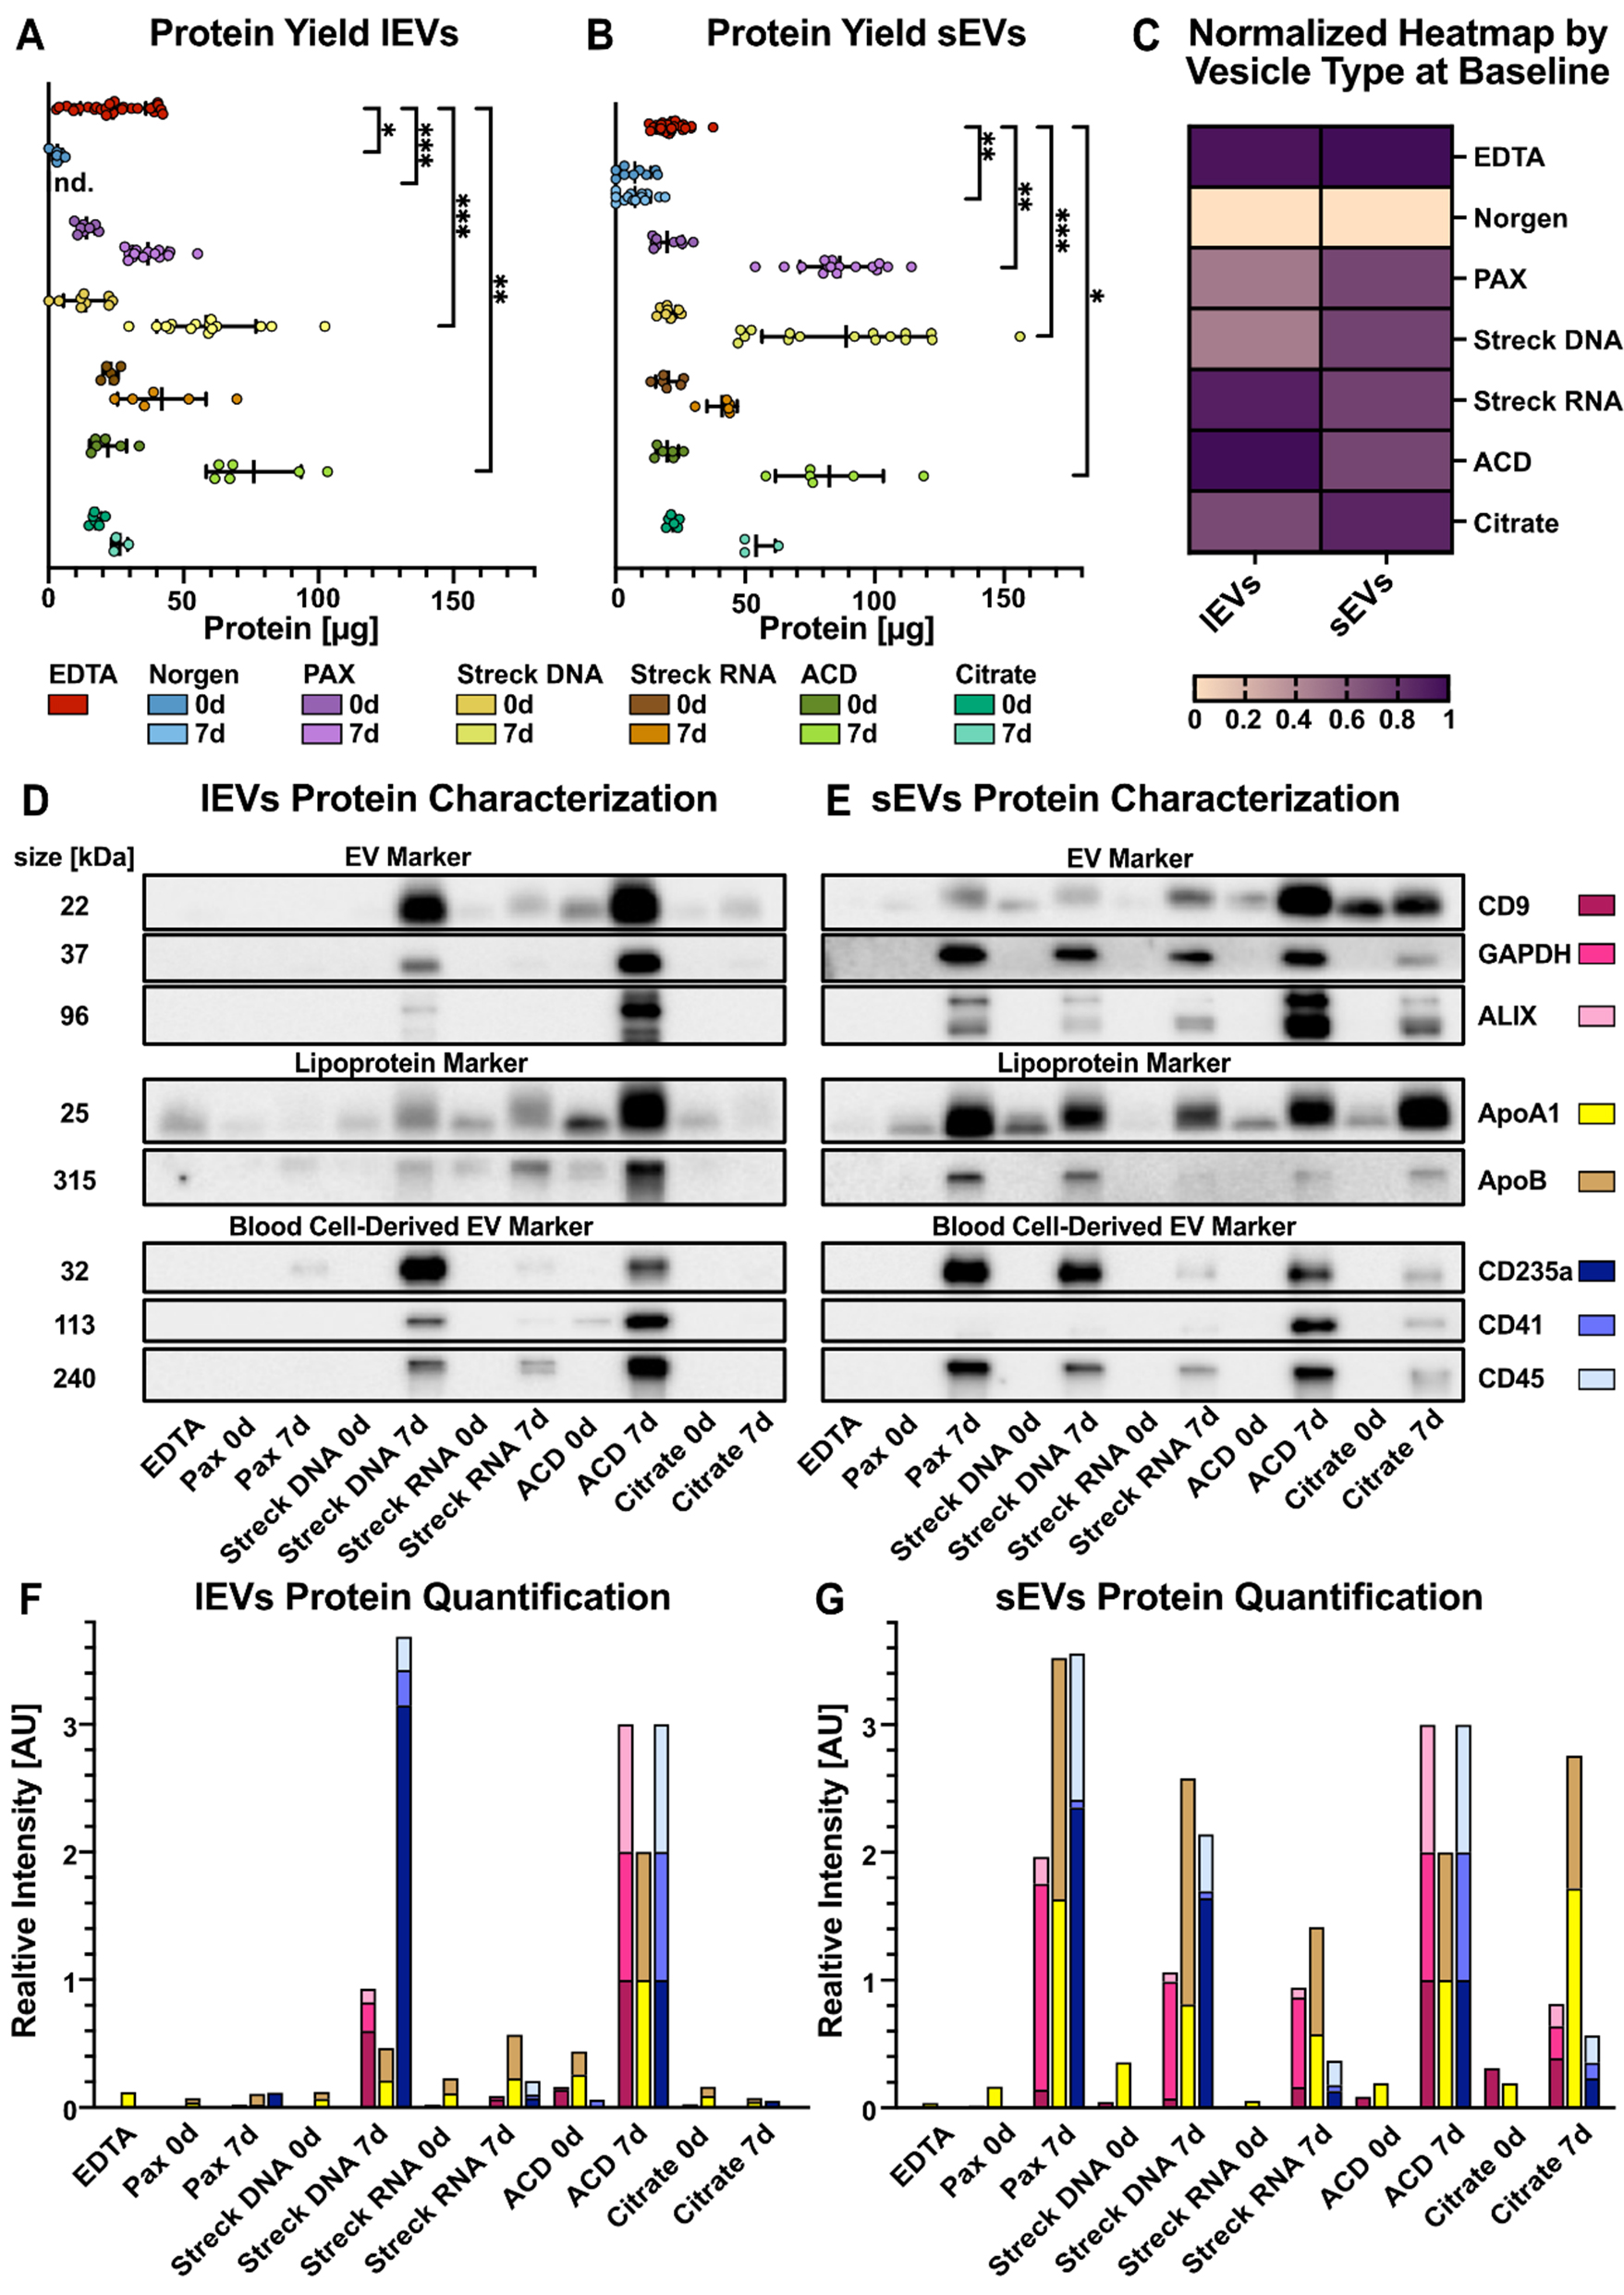
Figure 3. Quantitative analysis of lEVs and sEVs. (A) lEV and (B) sEV amounts quantified as the total amount of protein in the three peak SEC fractions combined, allowing for direct comparison; (C) Protein amounts of lEV and sEV peak fractions, normalized and internally scaled per vesicle type, in the indicated tubes after immediate processing; (D and E) Western blot analyses of pooled lEV and sEV peak fractions. EVs isolated from three healthy individuals were pooled in equal volumes prior to Western blotting to ensure representability. Representative blots of classical EV markers, lipoprotein contaminants, and blood-derived EV markers, which serve as qualitative indicators of EV identity and purity, are shown; (F and G) Western blot quantification of protein bands. Signal intensities were normalized to the corresponding ACD 7 d band to account for variations in protein loading and transfer. Norgen was excluded from the Western blot analyses [Figure 3D-G] because of the limited amount of protein. Statistical significance in (A) and (B) was determined for all tube candidates via the Kruskal-Wallis test, followed by Dunn’s multiple comparisons test. *P < 0.05, **P < 0.01, ***P < 0.001. Statistically significant differences compared with EDTA are shown in the graphs; nonsignificant results are not labeled. EVs: Extracellular vesicles; lEVs: large EVs; sEVs: small EVs.


