


fig2
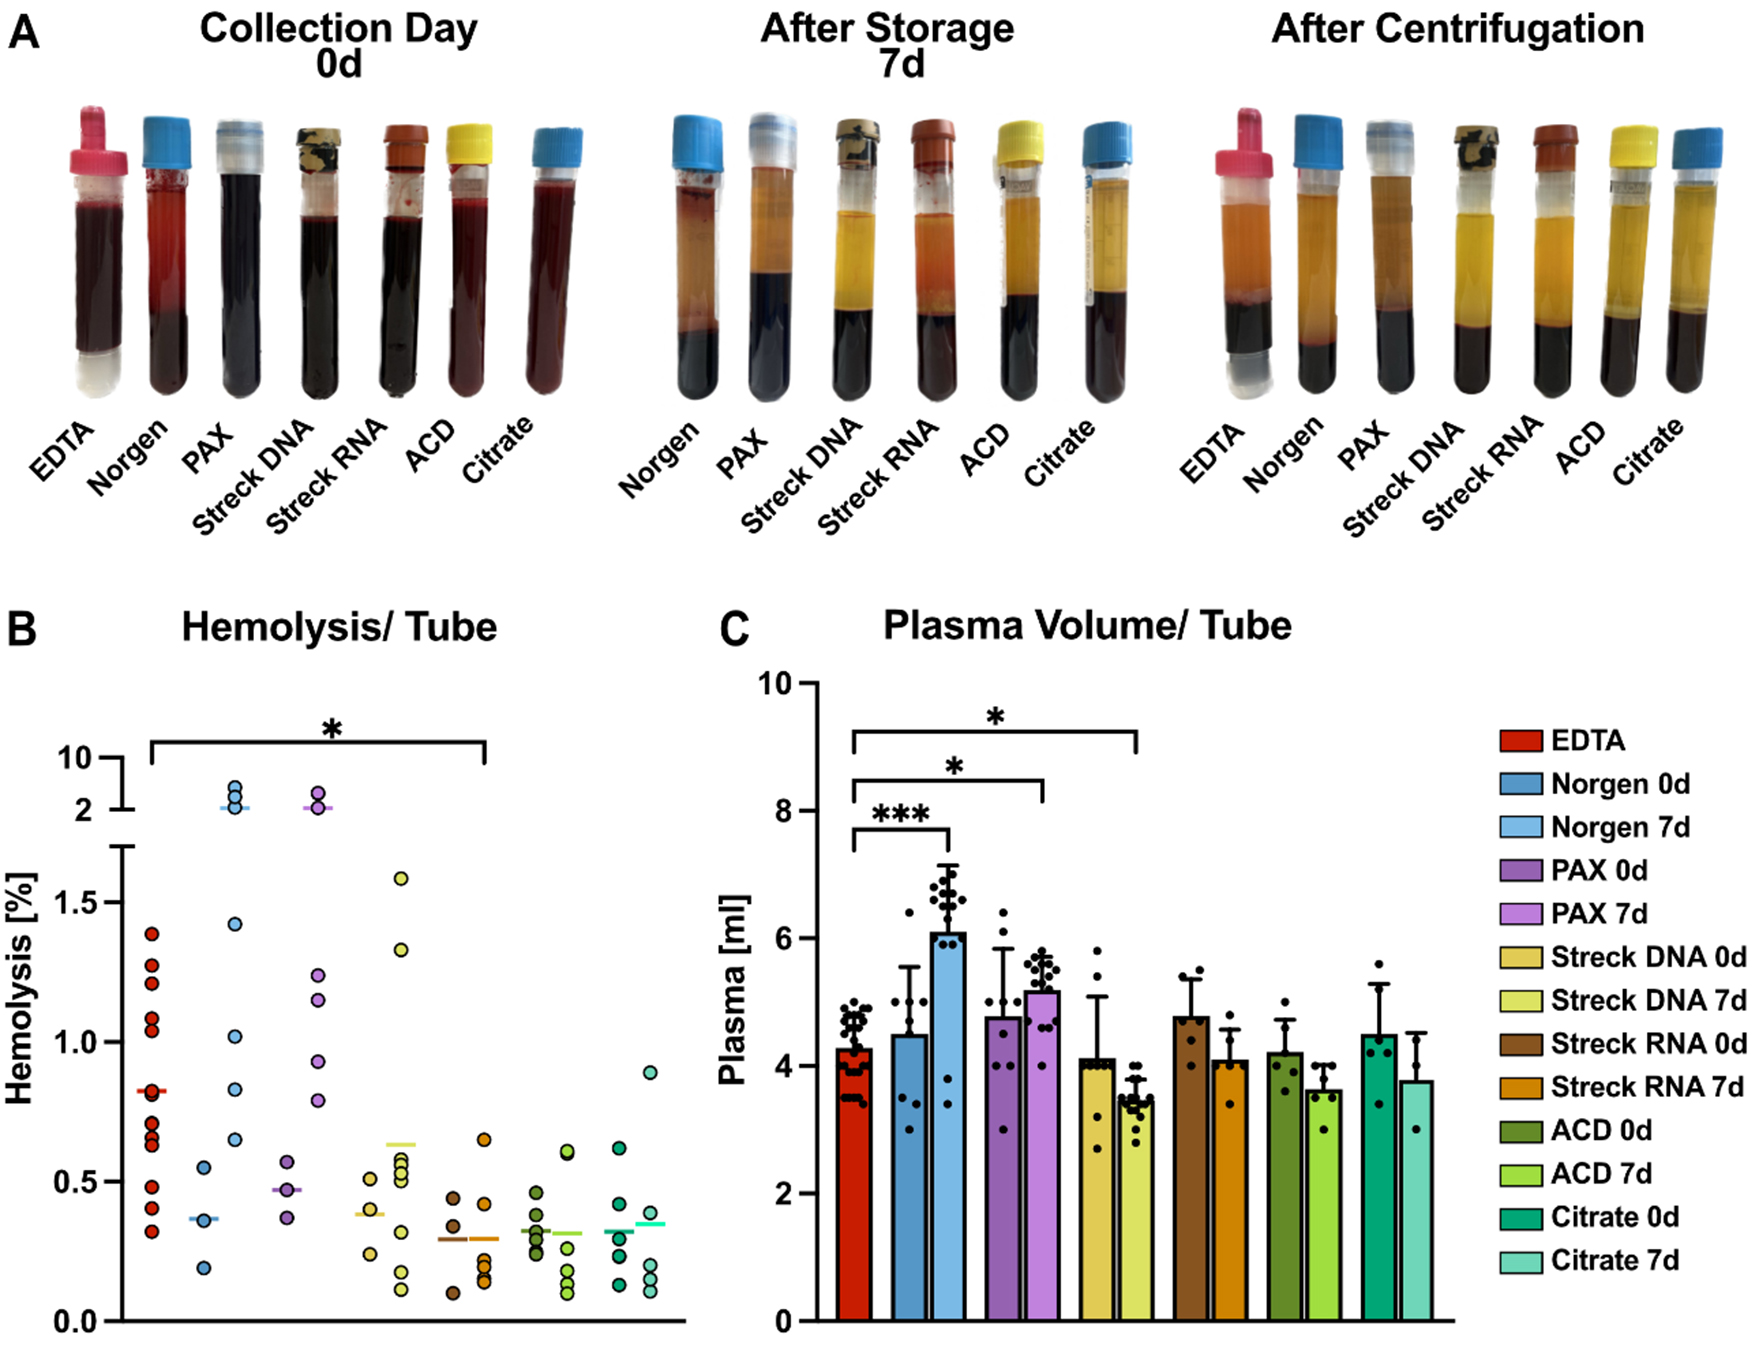
Figure 2. Comparative analysis of blood plasma collected from tube candidates. (A) Representative images of blood collection tubes, namely EDTA, Norgen, PAX, Streck DNA, Streck RNA, ACD-A, and Citrate, from one healthy donor for a direct comparison of tube appearance. Pictures were taken immediately after blood drawing (0 d, left), after 7 days of storage at RT (middle), and after plasma processing by centrifugation on day 0 (right); (B) Hemolysis levels determined by the relative levels of free hemoglobin measured as blood plasma absorbance at 414 nm; (C) Mean plasma volume obtained from the indicated blood tubes recovered after centrifugation. Statistical significance for (B) and (C) was determined for all tube candidates via the Kruskal-Wallis test, followed by Dunn’s multiple comparisons test. *P < 0.05, ***P < 0.001. Only statistically significant differences compared with EDTA are shown in the graphs; nonsignificant results are not labeled. RT: Room temperature.


