


fig4
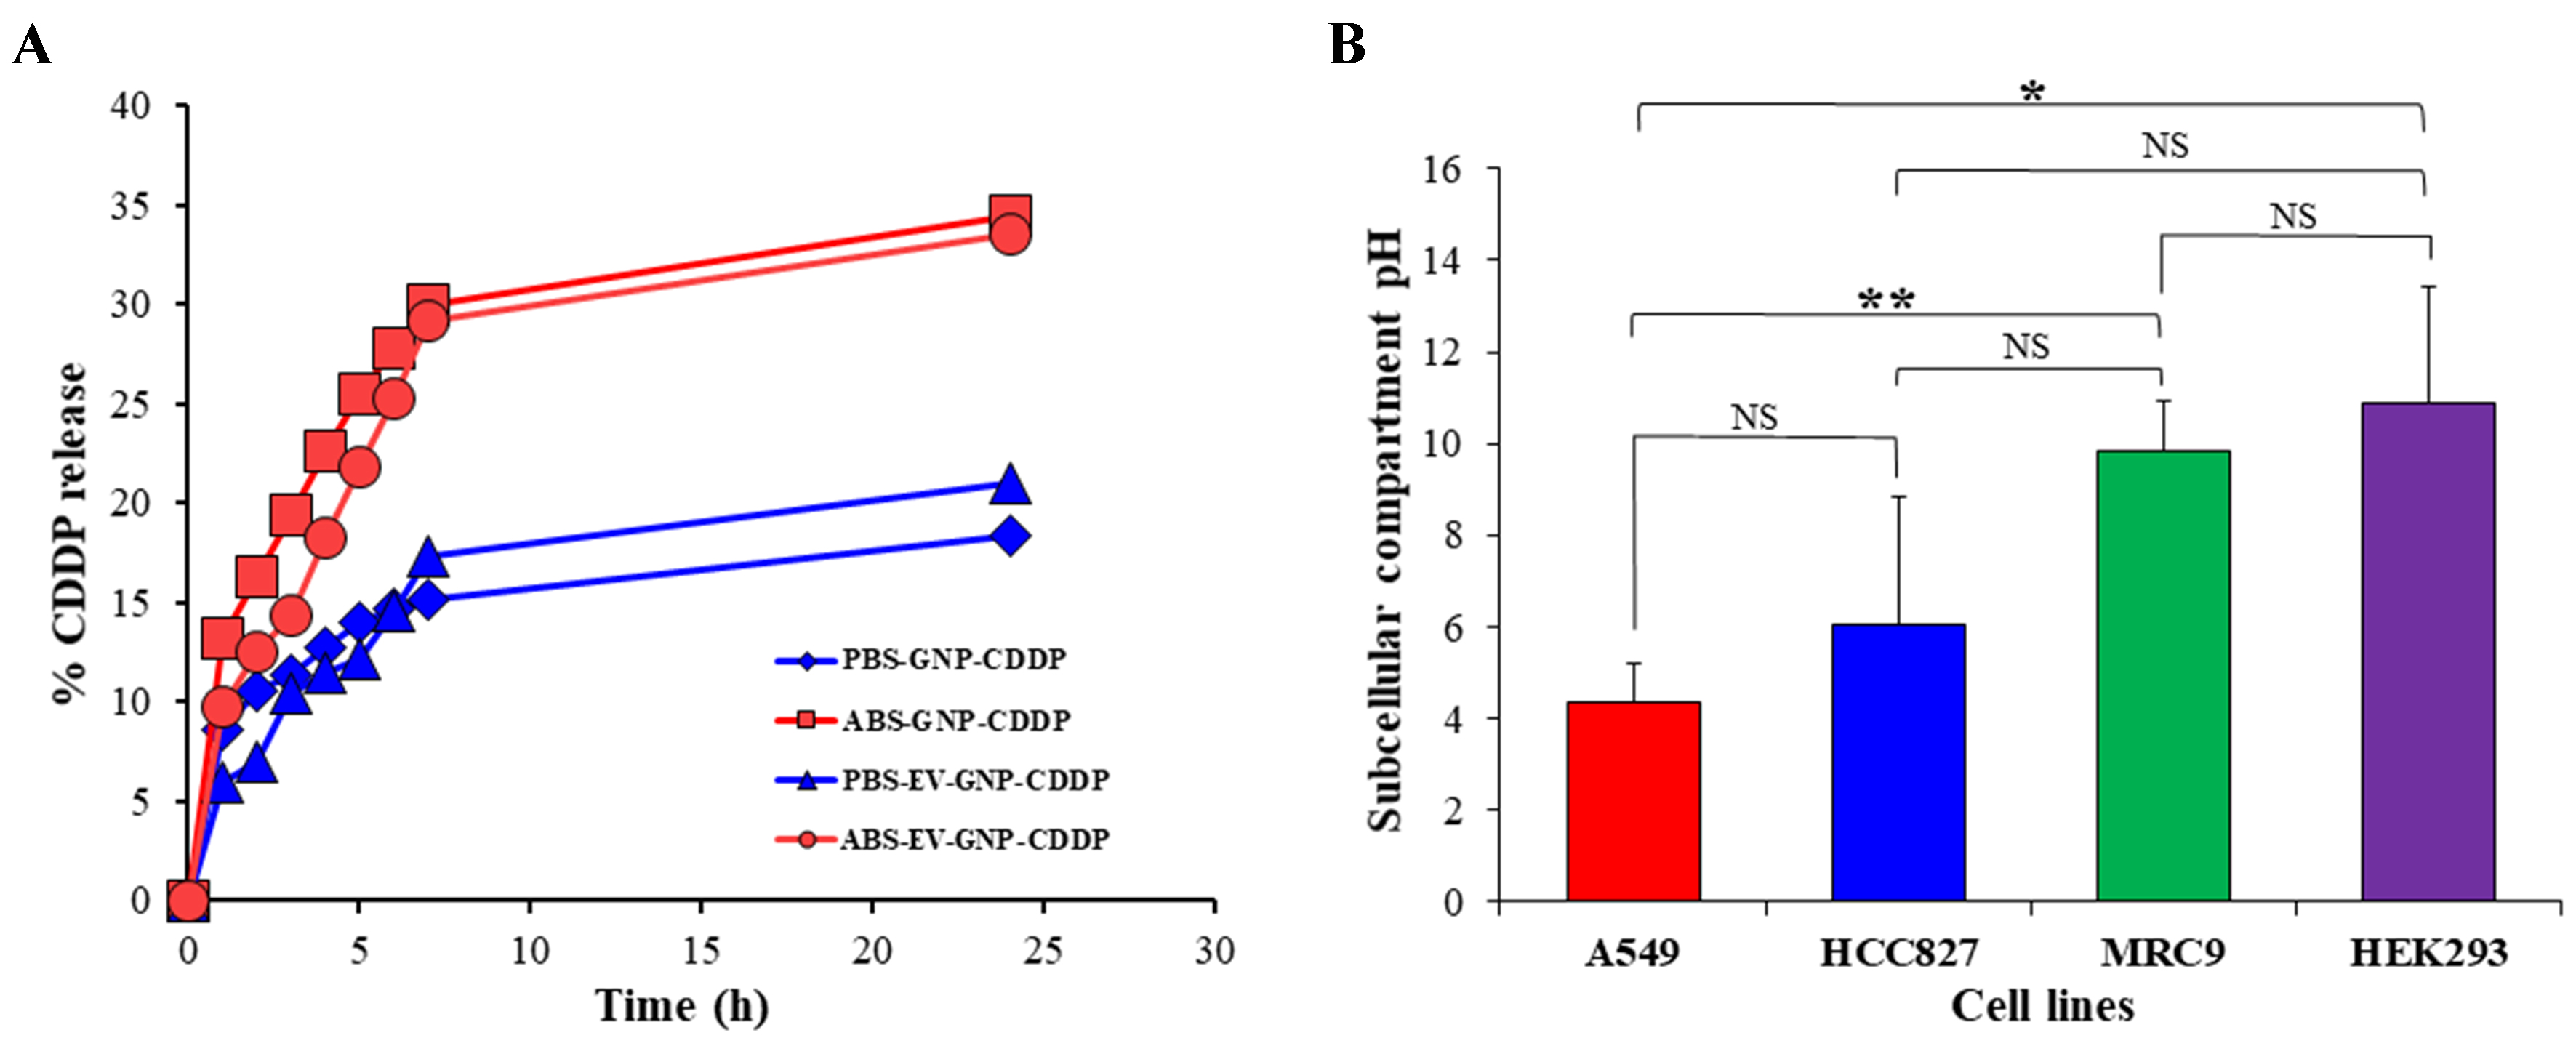
Figure 4. Assessment of in vitro drug release kinetics and intracellular pH. (A) CDDP release from GNP-CDDP and EV-GNP-CDDP was greater in acetate buffer (ABS, pH 5.5) compared to drug release in PBS buffer (PBS, pH 7.4); (B) Subcellular compartment pH measurement showed that tumor (A549, HCC827) cells were acidic compared to normal (MRC-9, HEK293) cells. The bar graph represents the mean ± SD from three replicates (n = 3). Statistical significance was assessed using an unpaired Student’s t-test, with P values indicated as *P < 0.05, **P < 0.01, NS denotes not significant. CDDP: Cisplatin; GNP: gold nanoparticle; EV: extracellular vesicle; ABS: acetate buffer; PBS: phosphate buffer; HEK293: human embryonic kidney 293; SD: standard deviation.


