


fig2
From: Tumor-targeted multifunctional extracellular vesicles as drug carriers for lung cancer therapy
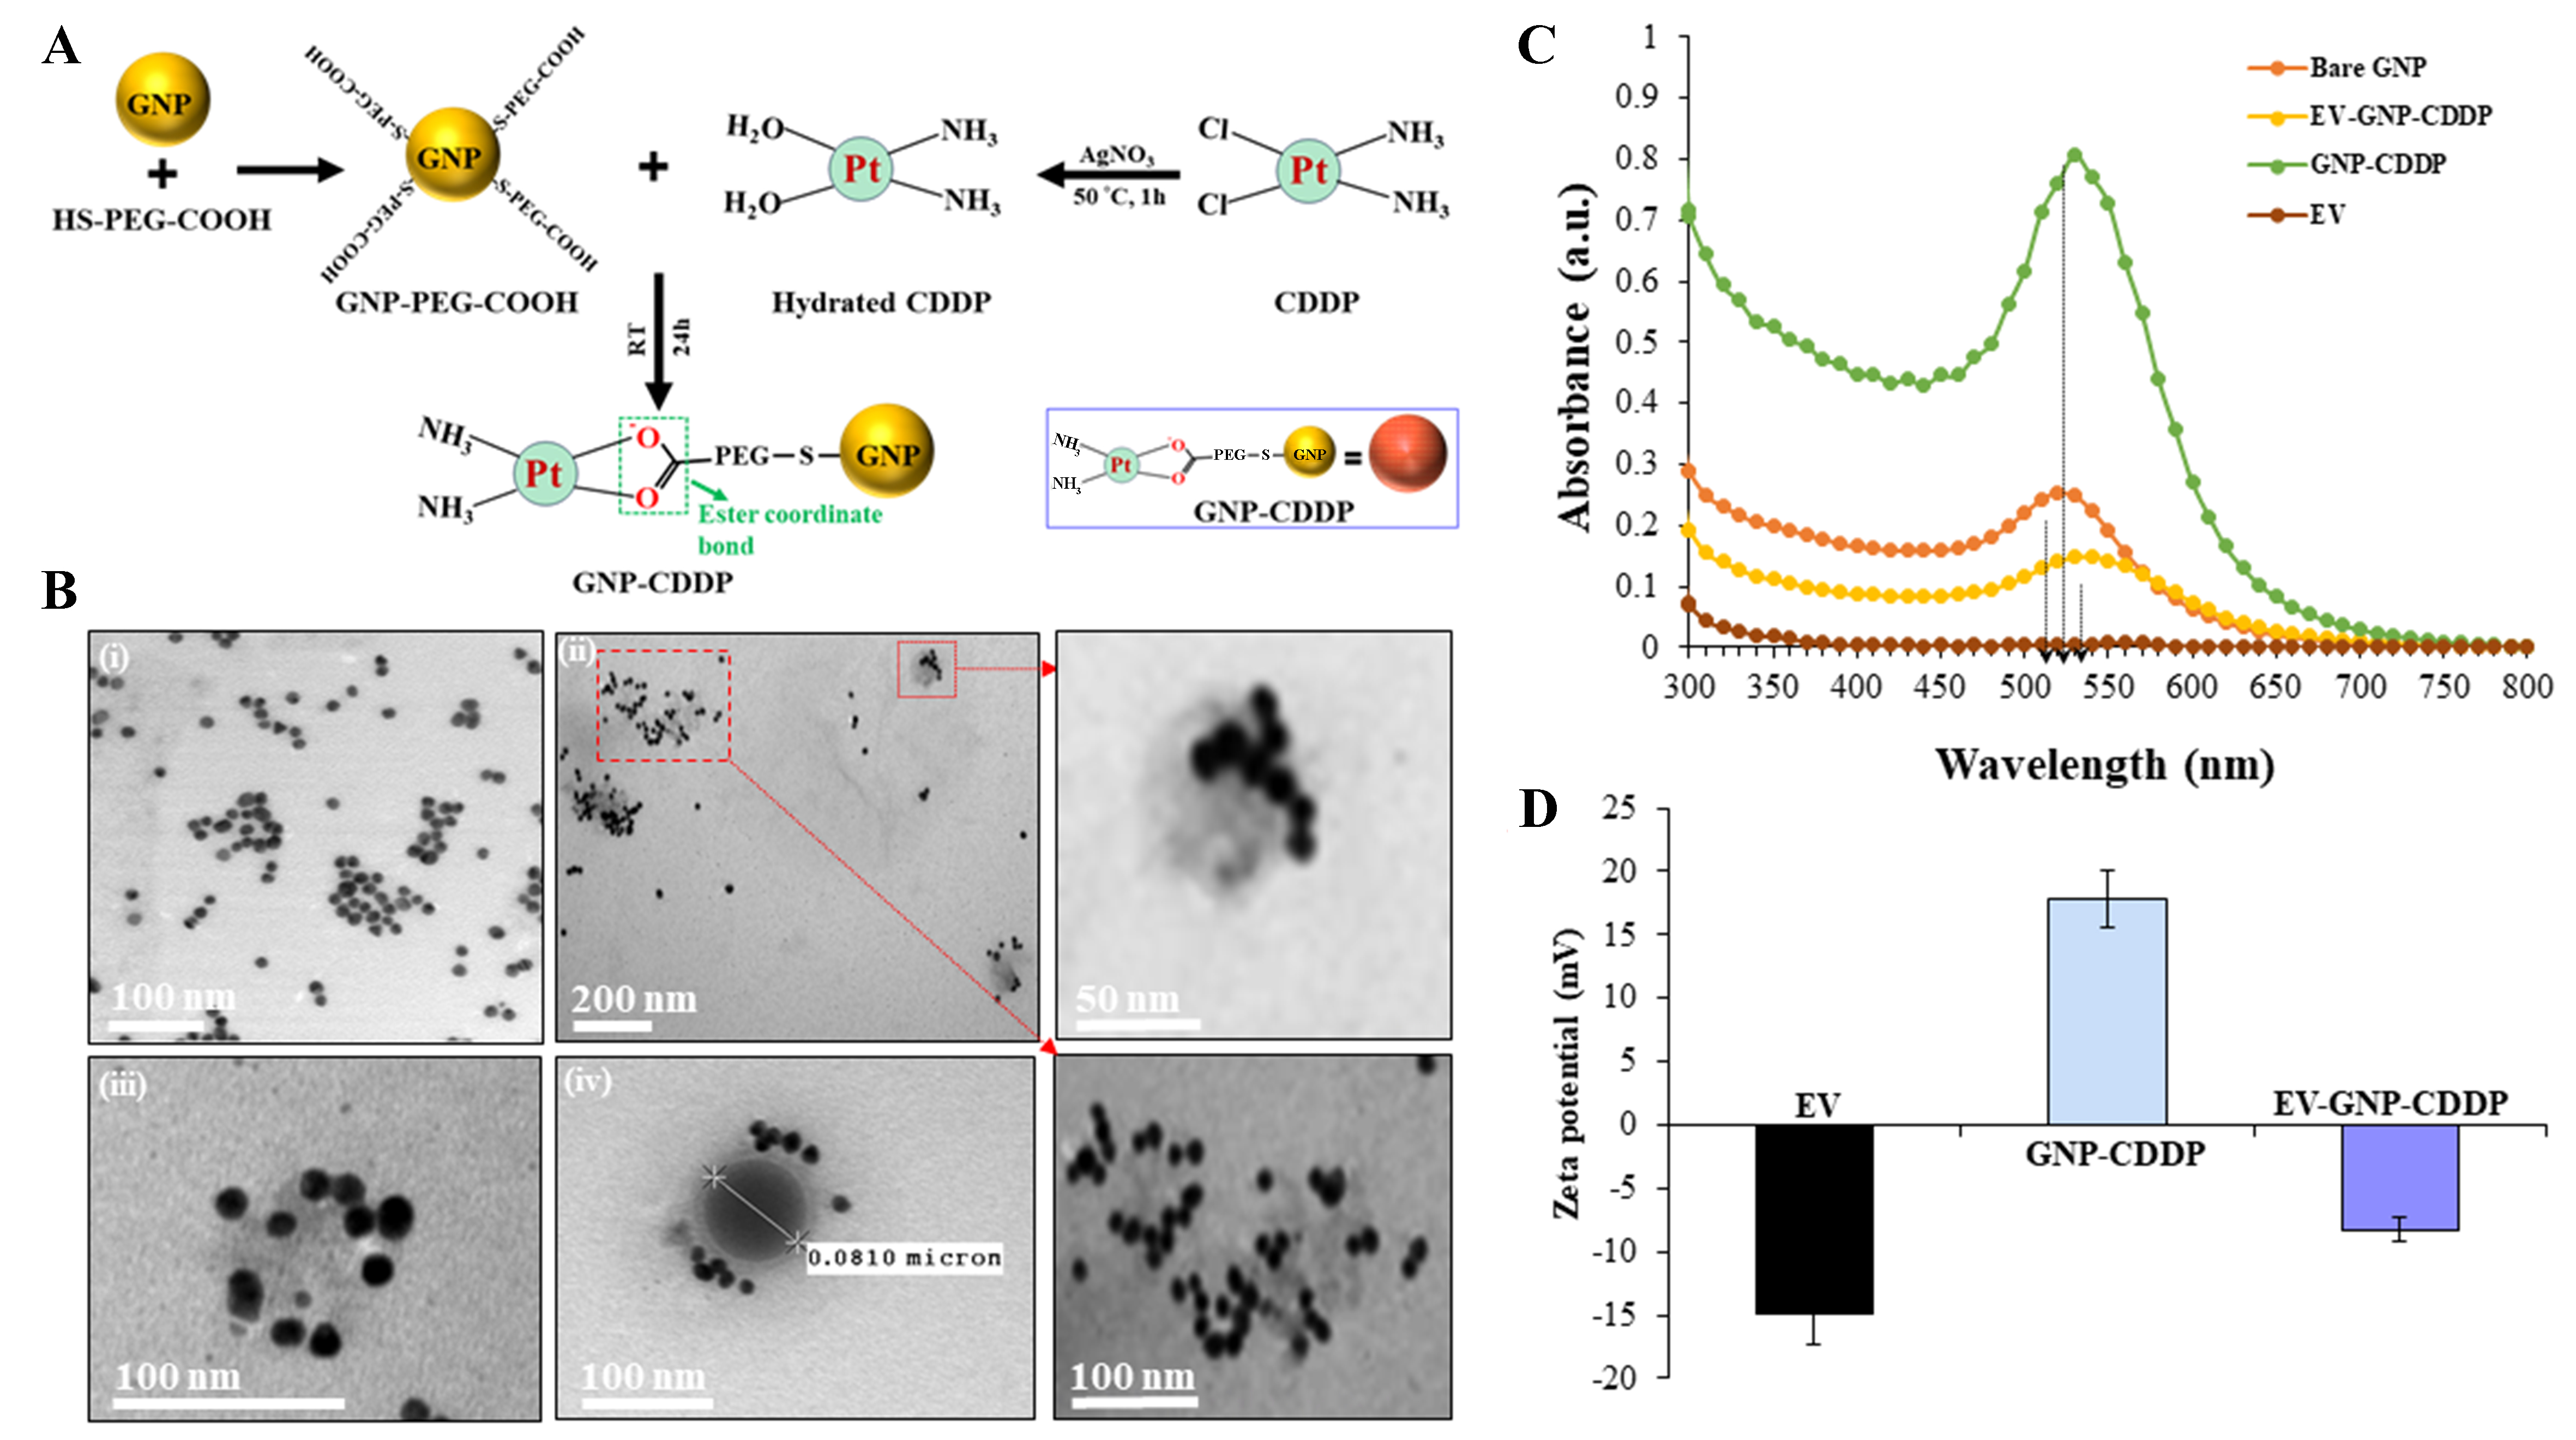
Figure 2. Synthesis and physicochemical characterizations of CDDP-functionalized GNPs and loading of CDDP-GNP into EVs. (A) Schematic illustration of the key stages of GNP-CDDP synthesis. This illustration was created using Microsoft PowerPoint; (B) TEM image of (i) GNPs and (ii-iv) EV-GNP-CDDP. The inset represents a boxed area showing an enlarged image; (C) Absorbance spectroscopy of EVs, bare GNPs, GNP-CDDP and EV-GNP-CDDP; (D) Zeta potential measurements at each step of preparing EV-GNP-CDDP. Bar graph represents the mean ± SD from three replicates (n = 3). CDDP: Cisplatin; GNPs: gold nanoparticles; EVs: extracellular vesicles; TEM: transmission electron microscopy; SD: standard deviation.


