


fig4
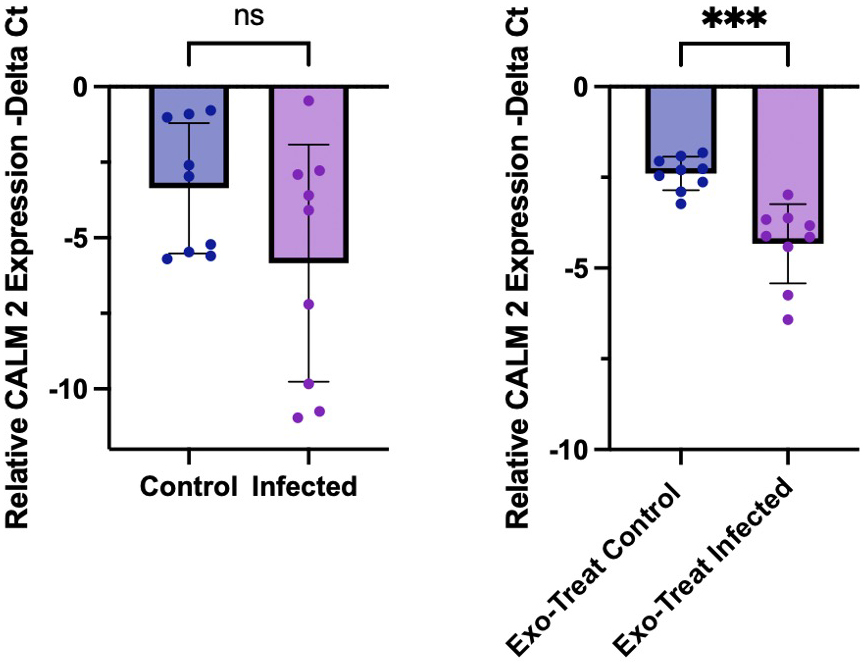
Figure 4. Quantitative PCR analysis of CALM2 expression. Relative messenger RNA (mRNA) levels of CALM2 (encoding calmodulin 2) were quantified by qPCR and normalised to GAPDH expression, presented as -ΔCt values. (A) Expression levels in uninfected and T. gondii-infected M17 cell cultures; (B) Expression in M17 cells treated with EVs, showing a significant reduction under infected conditions. Statistical analysis was performed using Welch’s t-test in GraphPad Prism. Error bars indicate standard deviation; P < 0.05. PCR: Polymerase chain reaction; EV: extracellular vesicle.


