


fig2
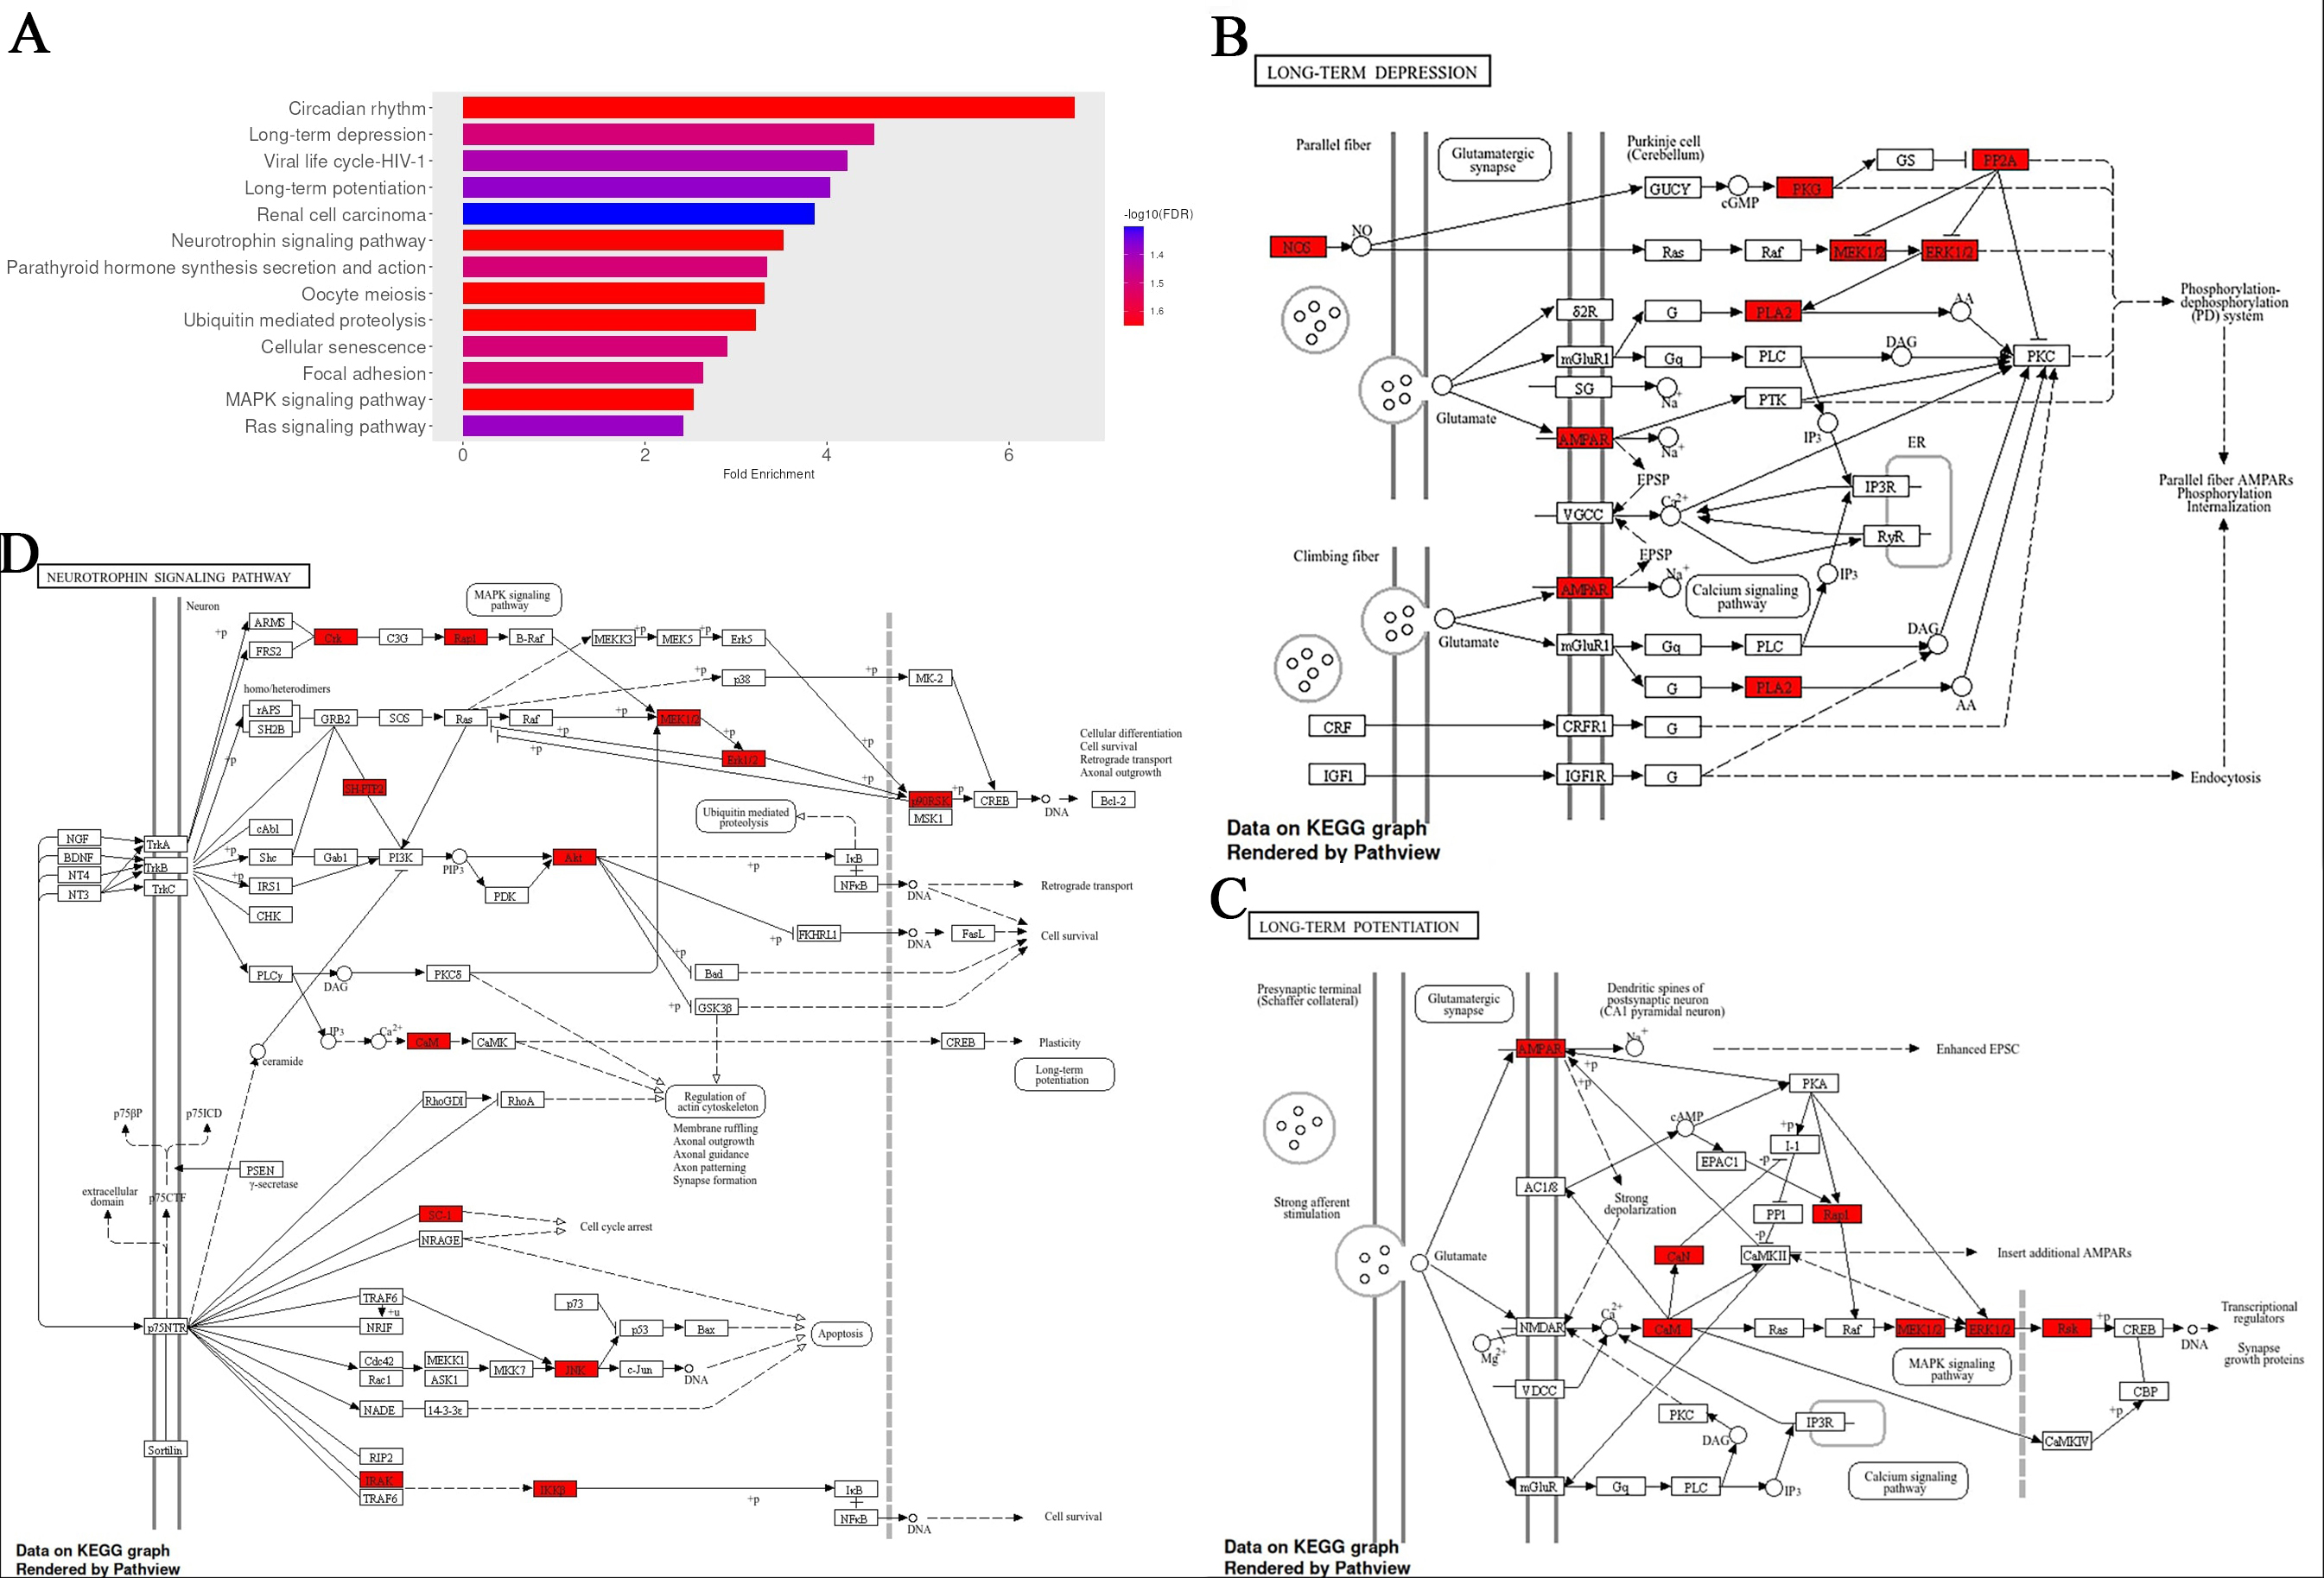
Figure 2. Fold enrichment analysis of pathways associated with genes that are targets of top the 13 upregulated EV miRNAs with infection. (A) Fold enrichment chart for biological processes, horizontal bars represent the magnitude of enrichment for each pathway, calculated as fold enrichment relative to background expectation. Colour intensity reflects statistical significance, with a gradient based on -log10(FDR); darker blue tones indicate lower false discovery rates and thus stronger enrichment confidence; (B-D) KEGG pathway analysis for the long-term depression, long-term potentiation, and Neurotrophin signalling, respectively, with enrichment results using an FDR cutoff of 0.05. Red-colored genes represent those linked to the top 13 differentially expressed miRNAs. All figures were generated using the ShinyGO platform v0.82. Full size images of A-D, and MAPK & Ras signalling pathways are shown in the Supplementary Materials. EV: Extracellular vesicle; KEGG: Kyoto Encyclopedia of Genes and Genomes; FDR: false discovery rate; Ras: rat sarcoma.


