


fig1
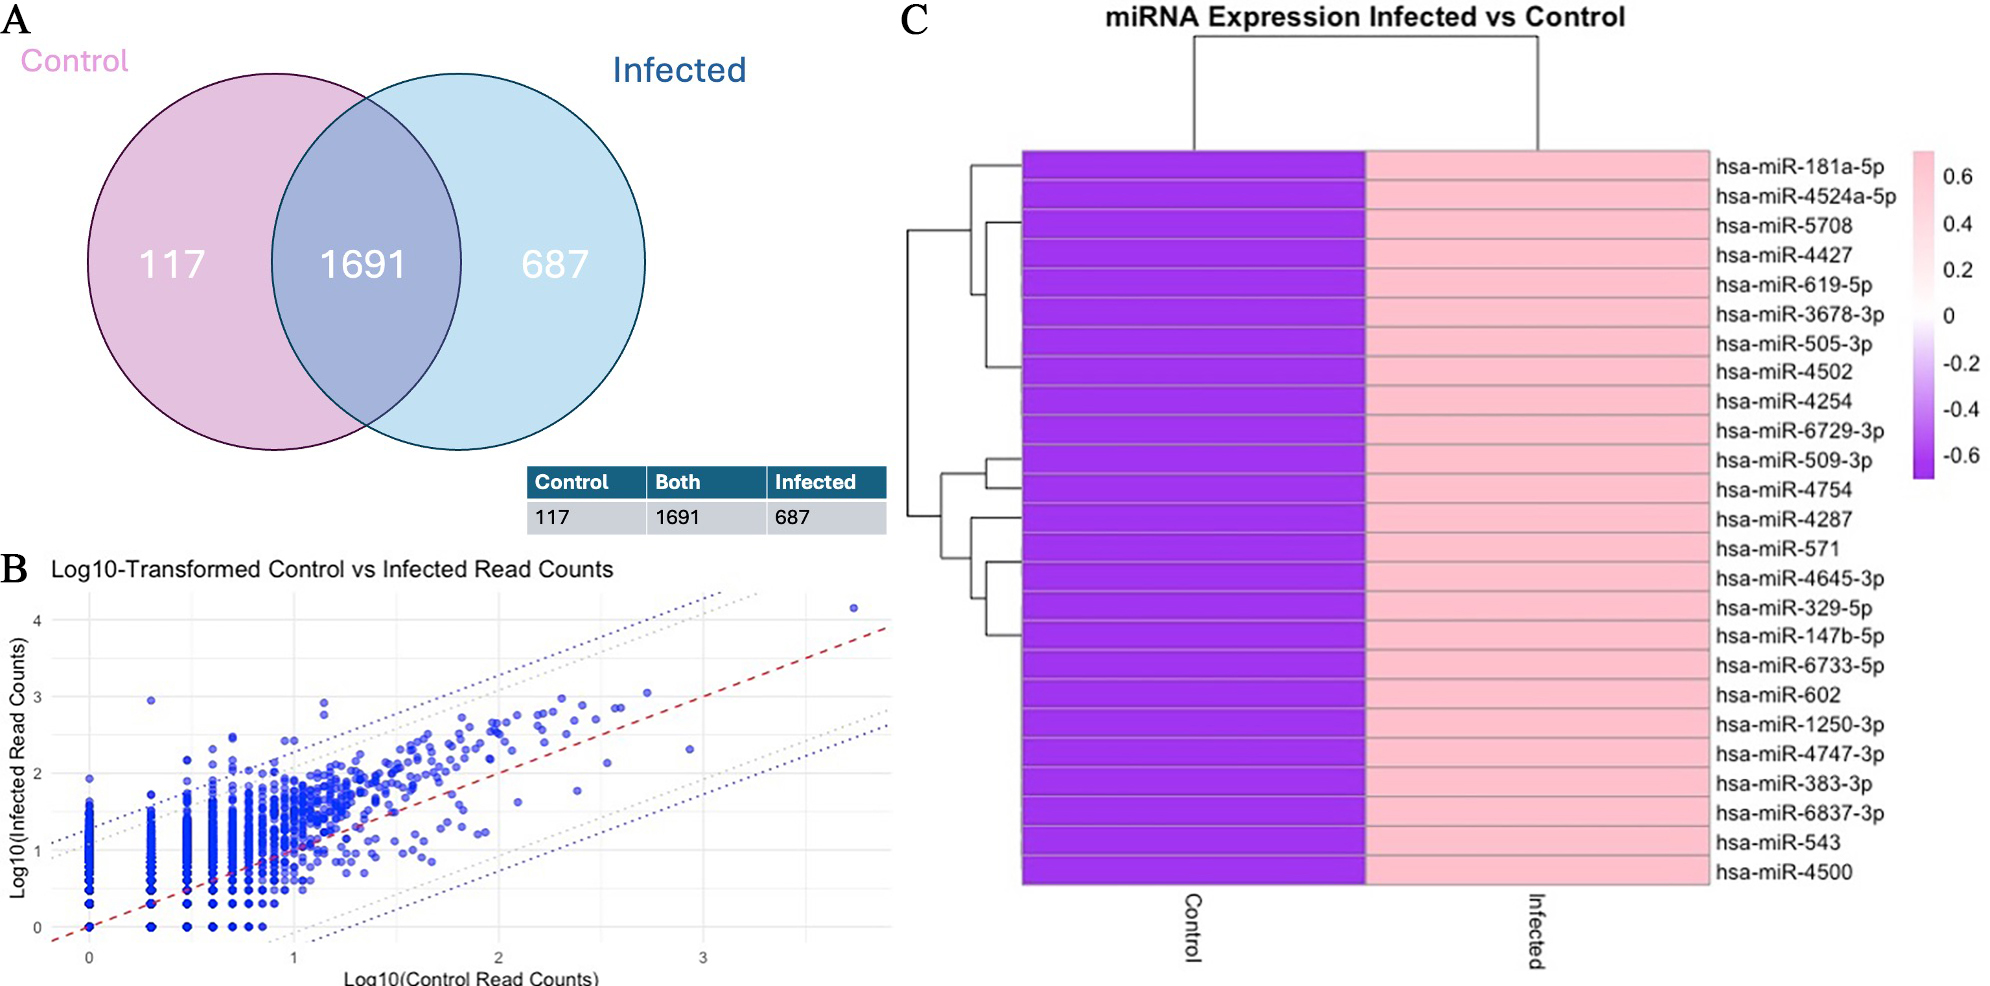
Figure 1. Differential miRNAs in extracellular vesicles from T. gondii-infected human neuronal cells. (A) Venn diagram of the read counts (TPM) illustrating the number of miRNAs that overlap between control and infected; (B) Scatter plot comparing the log10-transformed read counts (TPM) of control (x-axis) and infected (y-axis) samples for each individual miRNA. The central red dotted line represents the identity line (y = x), while the two parallel dotted lines indicate the 95th and 98th percentiles of differential expression. This plot highlights the upregulation and downregulation of miRNAs in infected samples compared to controls; (C) Heatmap of Z-score normalised log10-transformed read counts (TPM) for control and infected samples, illustrating differential expression across miRNAs. The colour scale ranges from purple (-0.6) to pink (0.6), representing the magnitude of expression changes. Hierarchical clustering was applied to both rows (miRNAs) and columns (samples) to identify groups with similar expression patterns, with branches (dendrograms) displaying these clusters. Generated using software in R.


