

fig2
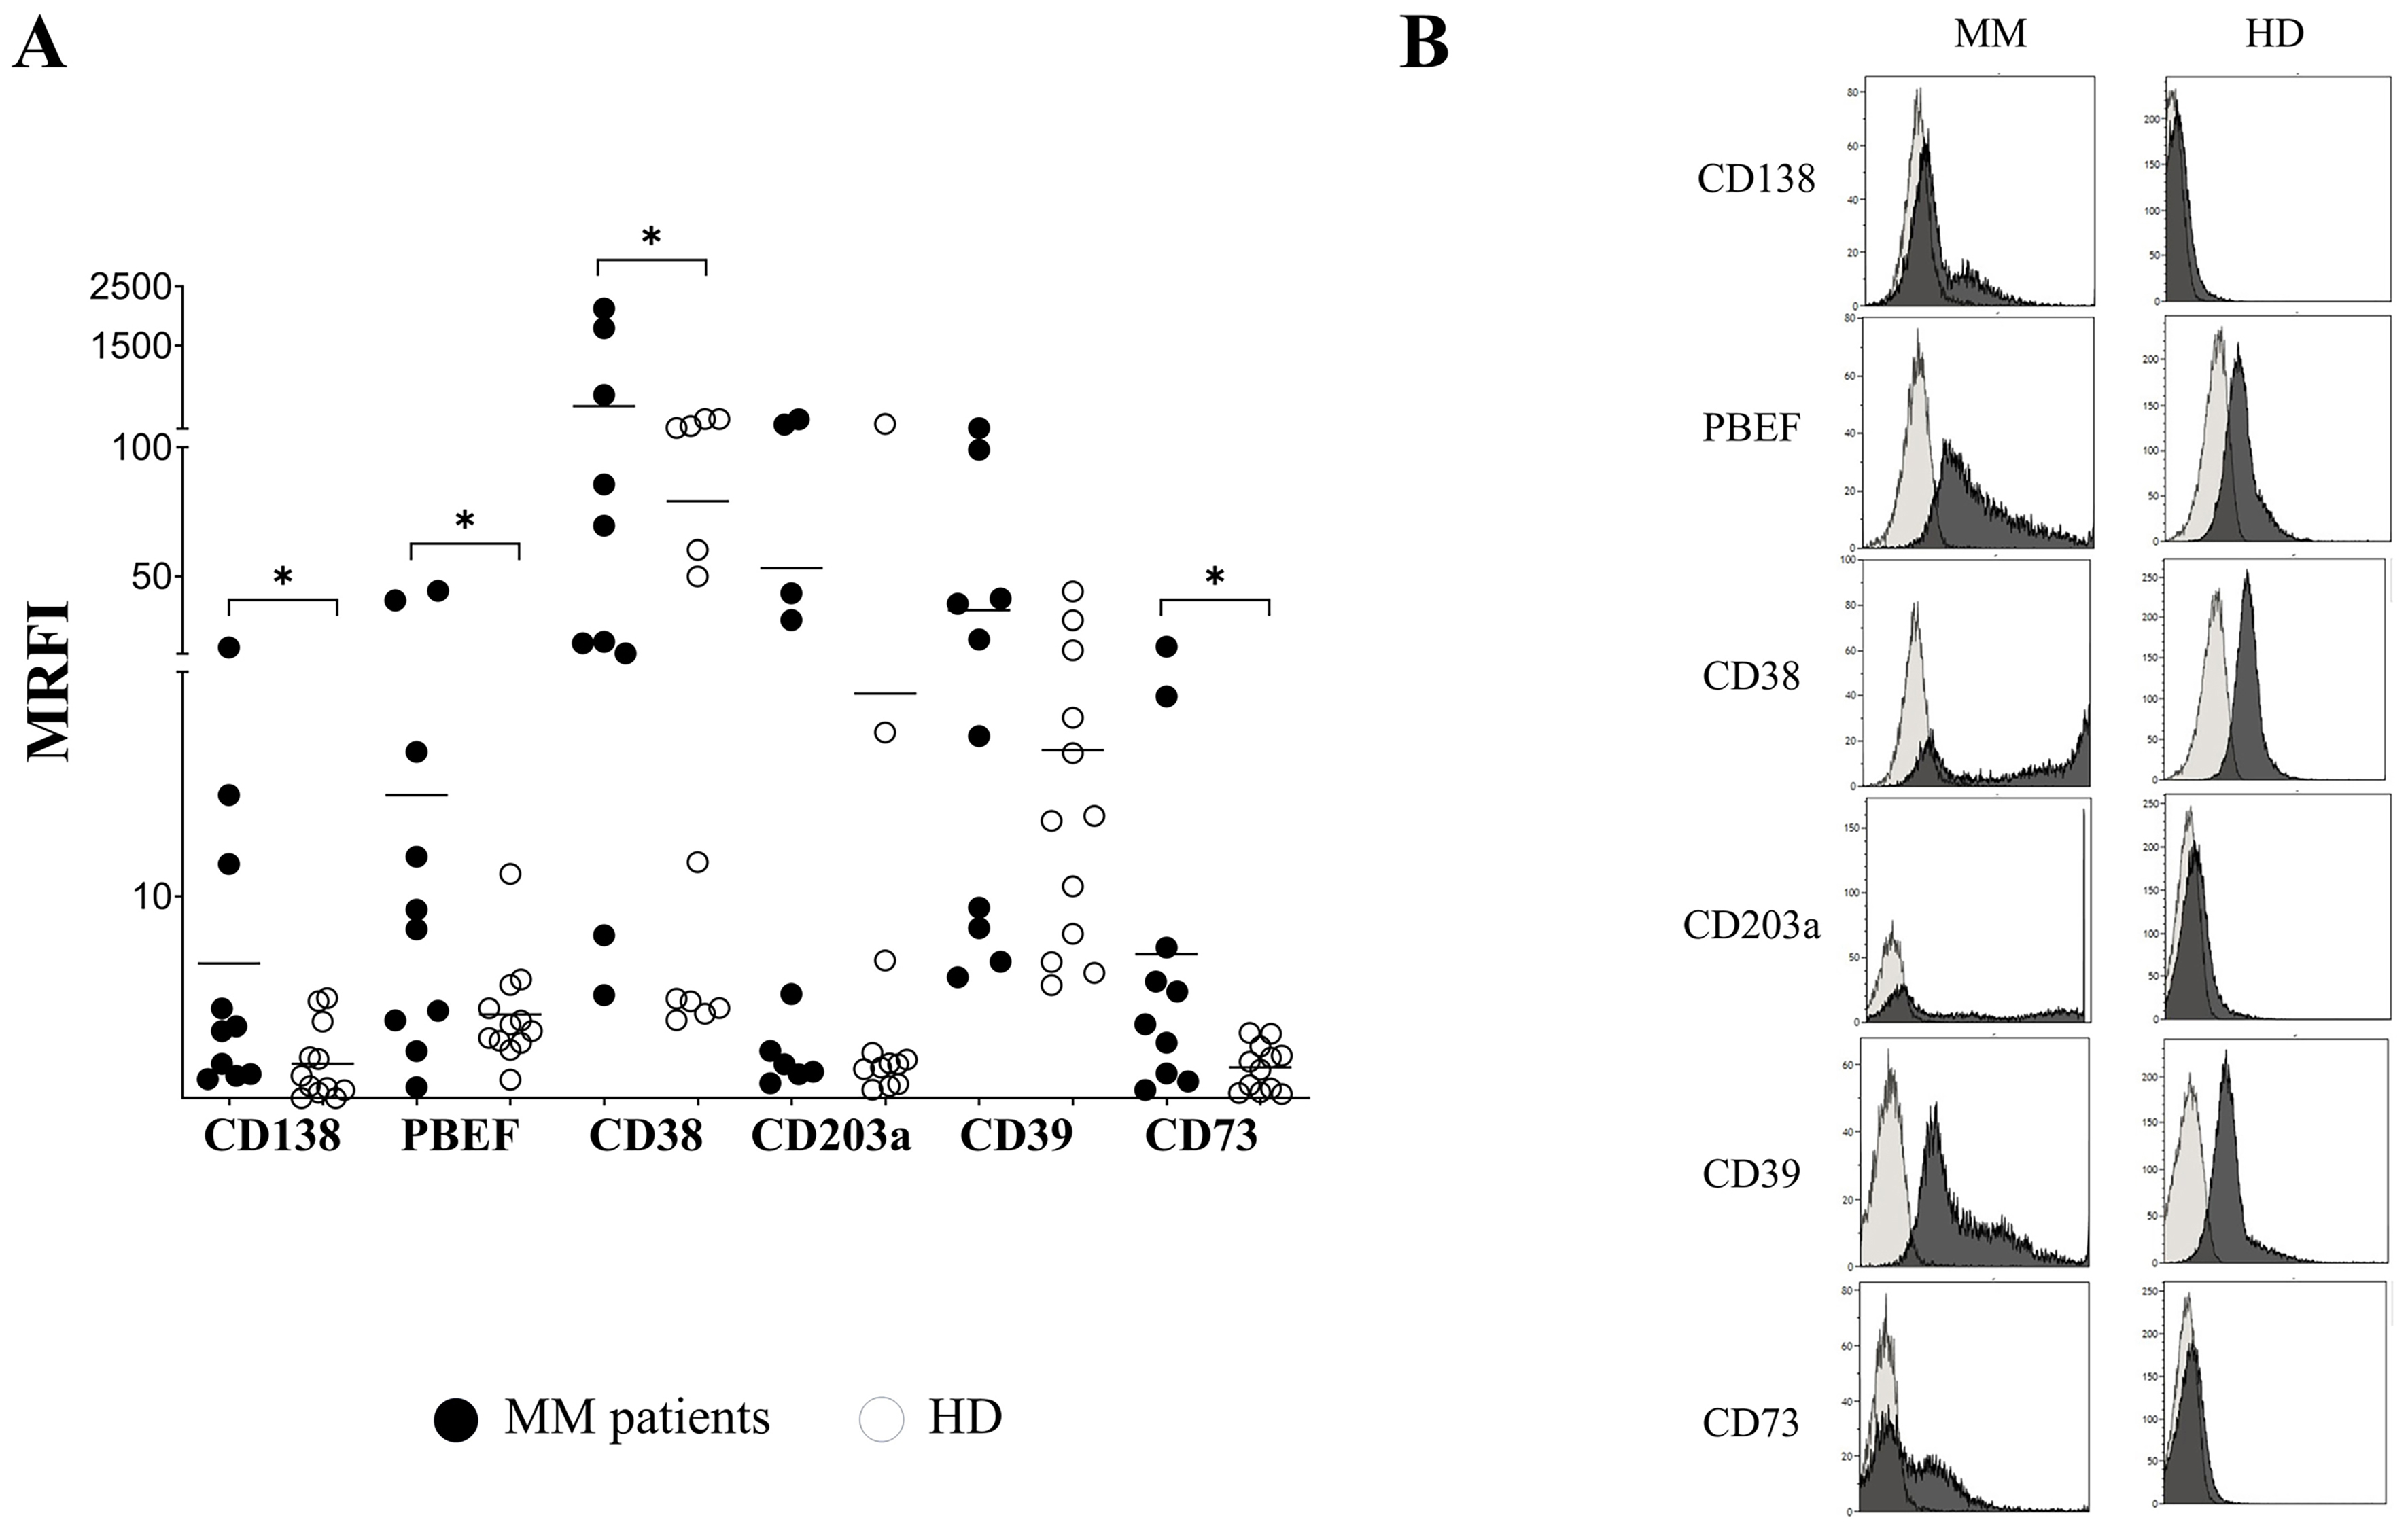
Figure 2. Immunophenotype of EVs. (A) EVs from PB plasma samples obtained from MM patients (n = 10, black dots) and HDs (n = 12, white dots) were analyzed by flow cytometry to assess the expression of CD138, NAMPT/PBEF1 (PBEF), CD38, CD203a, CD39, and CD73. Data are expressed as MRFI. Horizontal bars indicate the mean. Asterisk indicated statistically significant differences calculated using the Mann-Whitney test or unpaired t test, depending on data distribution (*P ≤ 0.05). A representative experiment is shown in (B). Dark grey profiles indicate staining with specific mAbs, whereas light grey profiles indicate staining with irrelevant isotype-matched mAbs. EVs: Extracellular vesicles; PB: peripheral blood; MM: multiple myeloma; HDs: healthy donors; NAMPT/PBEF1 (PBEF): nicotinamide phosphoribosyltransferase/pre-B-cell colony-enhancing factor 1; MRFI: mean relative fluorescence intensity; mAbs: monoclonal antibodies.




