

fig1
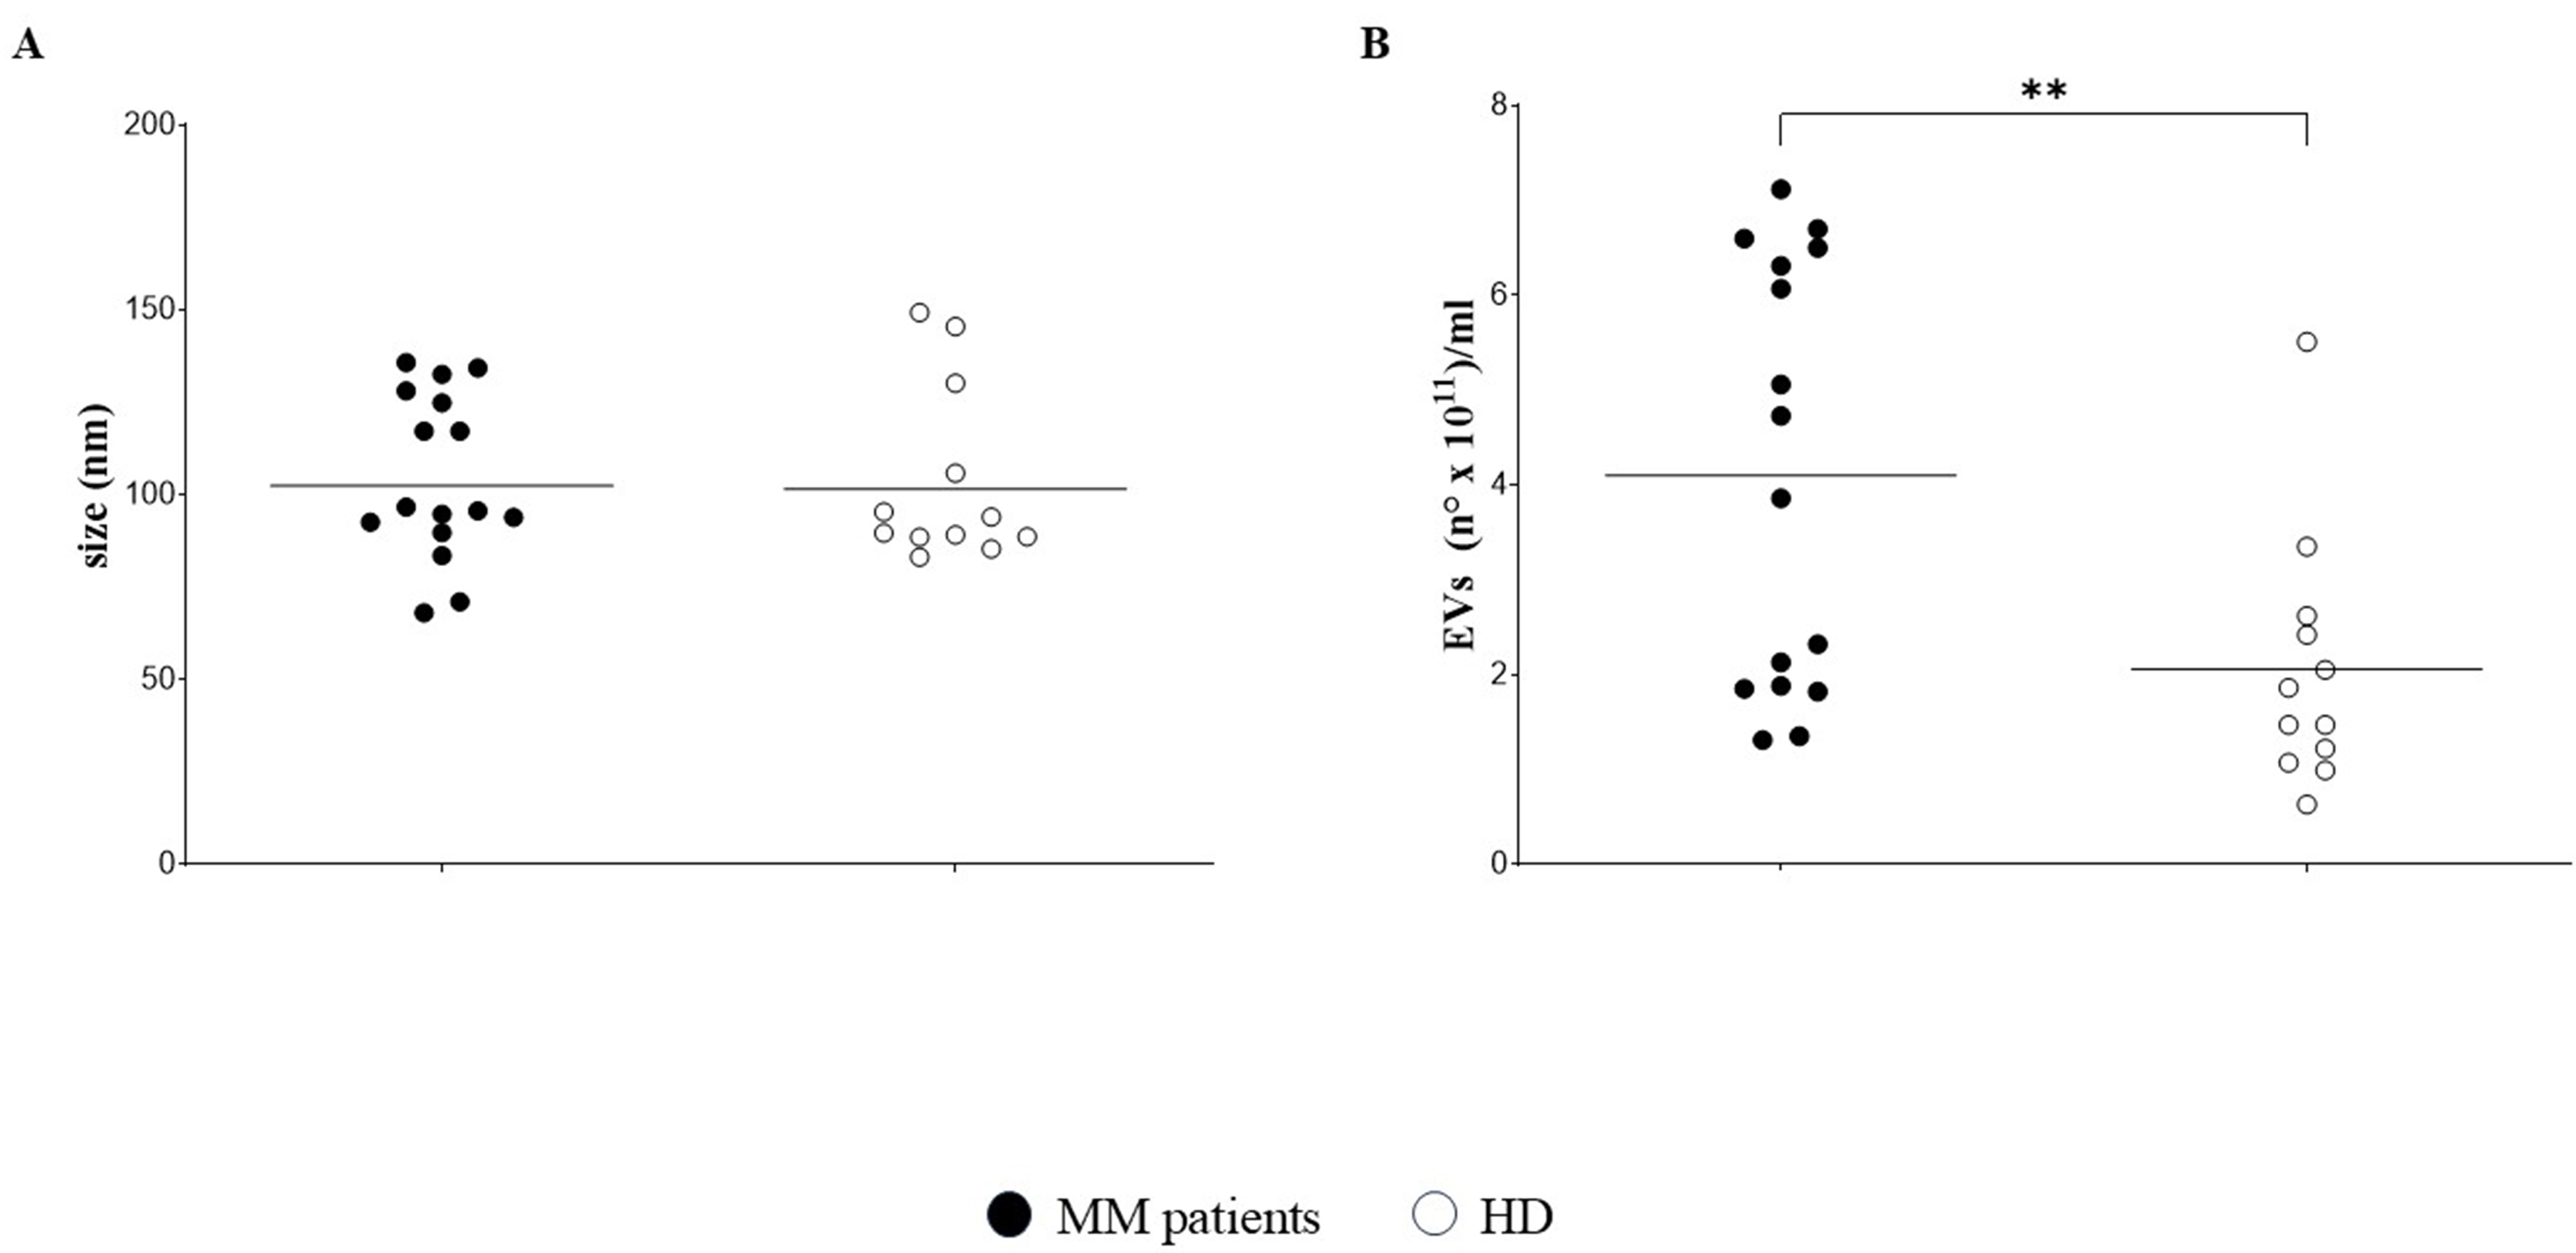
Figure 1. Characterization of EVs. EVs were characterized in 16 PB plasma samples from 13 MM patients and 12 HDs by NTA. Size distribution (nm) is shown in (A), whereas concentration (particles × 1011/mL) is shown in (B). Horizontal bars indicate the means. Asterisk indicates statistically significant differences as calculated by the Mann-Whitney test (**P ≤ 0.01). EVs: Extracellular vesicles; PB: peripheral blood; MM: multiple myeloma; HDs: healthy donors; NTA: nanoparticle tracking analysis.




