


fig7
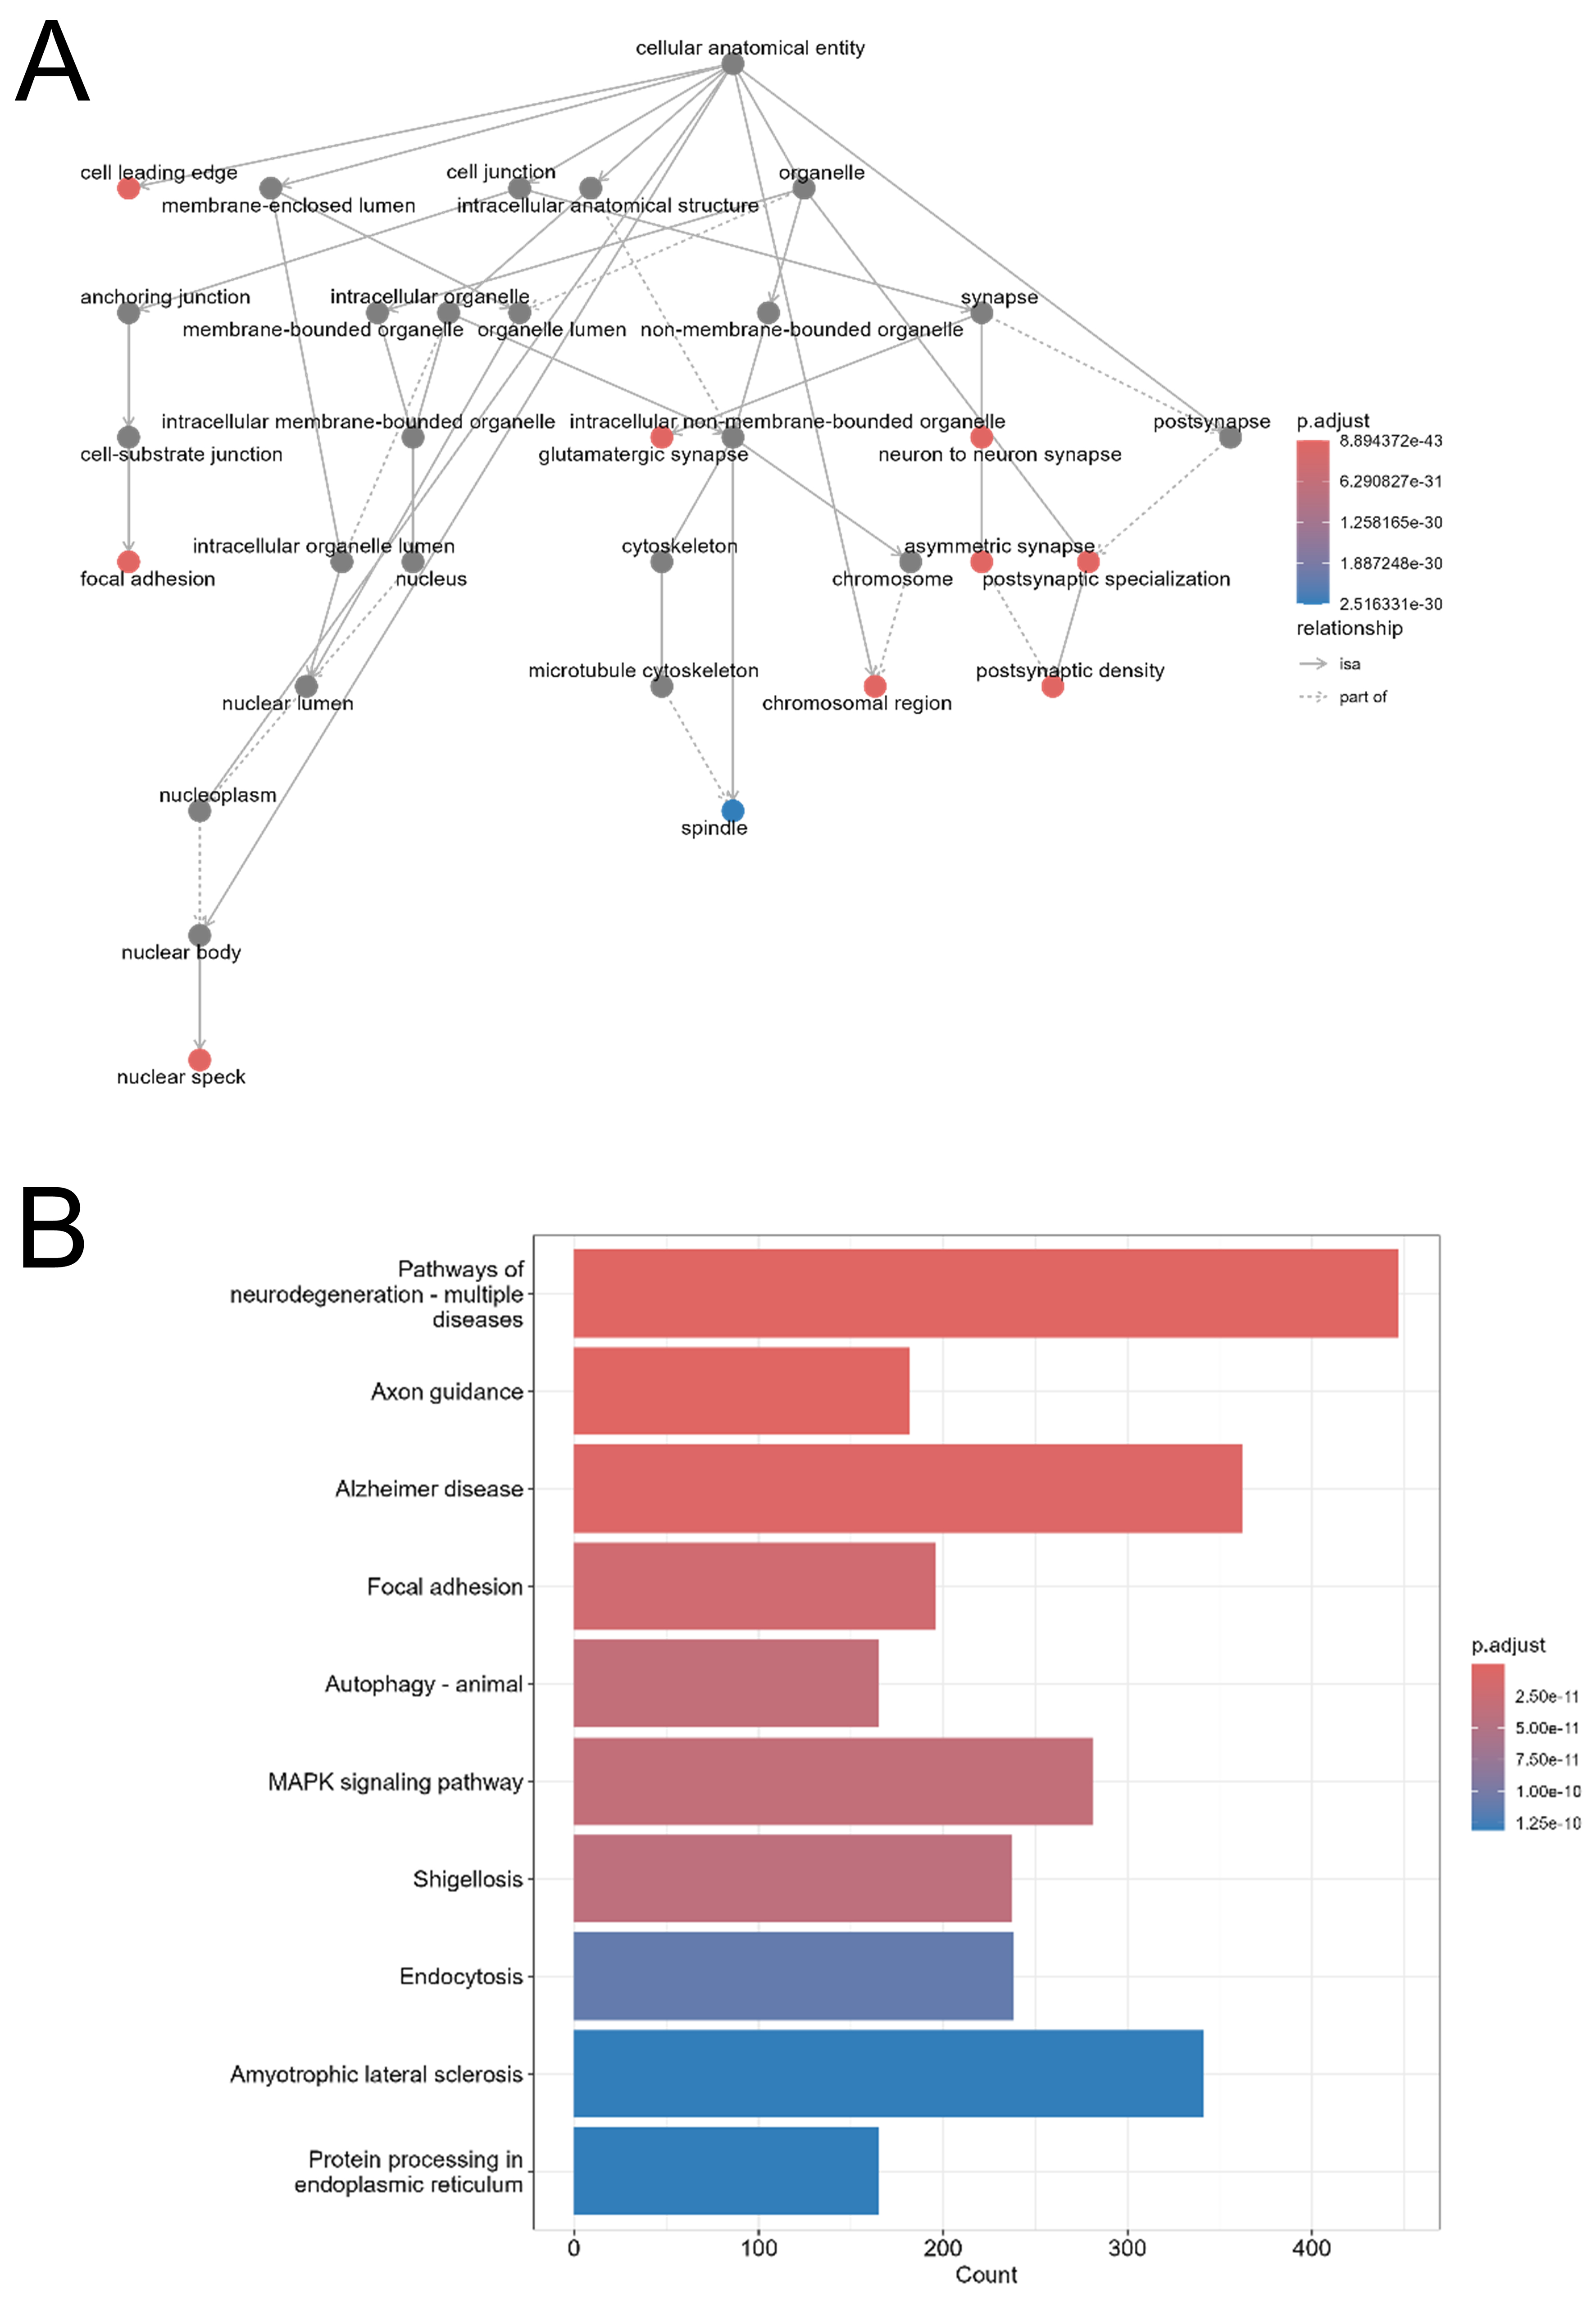
Figure 7. Functional enrichment analysis of target genes regulated by common salivary miRNAs. (A) GO cellular component enrichment network of 15,555 predicted target genes of the 28 miRNAs commonly regulated across all EV isolation methods (WS vs. M, Q, UC). Nodes represent GO terms; solid arrows indicate hierarchical subcategories; dashed arrows show associative links. Node color reflects adjusted P-value: red for most statistically significant, blue for least statistically significant, and grey for non-significant terms. Analysis and visualization were performed using the clusterProfiler R package (v4.10.1); (B) KEGG pathway enrichment of the same 15,555 target genes. The x-axis shows the number of genes per pathway; the y-axis lists enriched KEGG pathways. The bar color gradient reflects statistical significance (adjusted P-value), with red indicating higher significance and blue indicating lower significance. Analysis was conducted with clusterProfiler (v4.10.1) using the KEGG database (https://www.genome.jp/kegg/). WS: Whole saliva supernatant; EV: extracellular vesicles; UC: ultracentrifugation; Q: PEG-based co-precipitation; M: immunoaffinity capture; GO: Gene Ontology; KEGG: Kyoto Encyclopedia of Genes and Genomes; miRNA: microRNA.


